
| Export of goods from Finland and import to Finland | Trade Balance |
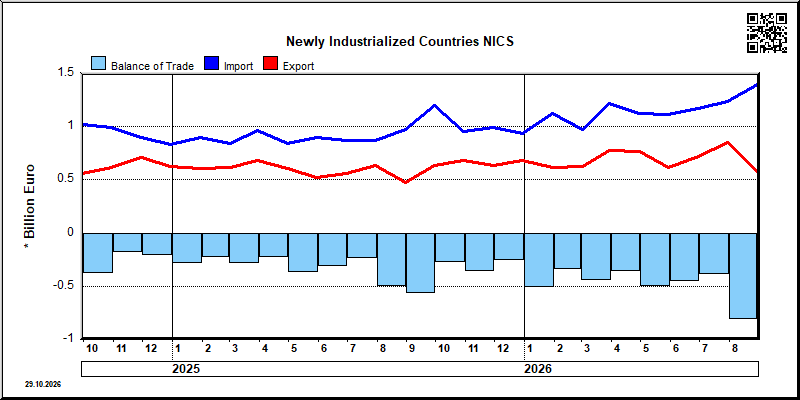
| Year | Month | Import 1,000 € | Export 1,000 € | Trade 1,000 € | Trade Balance 1,000 € |
|---|---|---|---|---|---|
| 2023 | 1 | 1,026,745 | 766,569 | 1,793,314 | -260,175 |
| 2023 | 2 | 680,838 | 485,109 | 1,165,947 | -195,729 |
| 2023 | 3 | 1,075,474 | 985,873 | 2,061,348 | -89,601 |
| 2023 | 4 | 849,040 | 755,498 | 1,604,539 | -93,542 |
| 2023 | 5 | 986,768 | 782,873 | 1,769,641 | -203,894 |
| 2023 | 6 | 857,955 | 738,953 | 1,596,908 | -119,002 |
| 2023 | 7 | 969,192 | 651,887 | 1,621,079 | -317,305 |
| 2023 | 8 | 894,135 | 682,702 | 1,576,837 | -211,433 |
| 2023 | 9 | 825,965 | 658,582 | 1,484,547 | -167,383 |
| 2023 | 10 | 905,431 | 620,048 | 1,525,479 | -285,383 |
| 2023 | 11 | 1,001,141 | 665,541 | 1,666,682 | -335,601 |
| 2023 | 12 | 997,728 | 629,542 | 1,627,270 | -368,186 |
| 2024 | 1 | 869,164 | 636,465 | 1,505,629 | -232,699 |
| 2024 | 2 | 833,668 | 577,776 | 1,411,444 | -255,892 |
| 2024 | 3 | 683,016 | 391,050 | 1,074,067 | -291,966 |
| 2024 | 4 | 1,196,771 | 716,942 | 1,913,713 | -479,828 |
| 2024 | 5 | 1,047,984 | 764,808 | 1,812,792 | -283,176 |
| 2024 | 6 | 882,513 | 753,817 | 1,636,329 | -128,696 |
| 2024 | 7 | 850,113 | 671,652 | 1,521,765 | -178,460 |
| 2024 | 8 | 1,005,112 | 602,144 | 1,607,256 | -402,968 |
| 2024 | 9 | 1,021,153 | 563,701 | 1,584,854 | -457,453 |
| 2024 | 10 | 994,061 | 616,232 | 1,610,293 | -377,829 |
| 2024 | 11 | 897,433 | 711,052 | 1,608,486 | -186,381 |
| 2024 | 12 | 836,618 | 626,428 | 1,463,046 | -210,190 |
| 2025 | 1 | 900,474 | 611,495 | 1,511,970 | -288,979 |
| 2025 | 2 | 846,542 | 615,881 | 1,462,423 | -230,660 |
| 2025 | 3 | 963,243 | 679,128 | 1,642,371 | -284,115 |
| 2025 | 4 | 844,366 | 611,231 | 1,455,597 | -233,136 |
| 2025 | 5 | 898,110 | 524,188 | 1,422,298 | -373,923 |
| 2025 | 6 | 873,892 | 563,617 | 1,437,509 | -310,275 |
| 2025 | 7 | 873,732 | 636,750 | 1,510,482 | -236,982 |
| 2025 | 8 | 975,516 | 475,462 | 1,450,978 | -500,054 |
| 2025 | 9 | 1,199,012 | 633,076 | 1,832,088 | -565,935 |
| 2025 | 10 | 953,203 | 678,510 | 1,631,713 | -274,693 |
| 2025 | 11 | 995,887 | 634,547 | 1,630,434 | -361,340 |
| 2025 | 12 | 936,466 | 682,616 | 1,619,082 | -253,850 |
| 2026 | 1 | 1,120,513 | 613,911 | 1,734,424 | -506,602 |
| 2026 | 2 | 969,913 | 625,821 | 1,595,733 | -344,092 |
| 2026 | 3 | 1,216,473 | 778,125 | 1,994,597 | -438,348 |
| 2026 | 4 | 1,137,114 | 763,084 | 1,900,199 | -374,030 |
| 2026 | 5 | 1,108,436 | 617,968 | 1,726,404 | -490,468 |
| 2026 | 6 | 1,169,733 | 717,320 | 1,887,053 | -452,413 |
| 2026 | 7 | 1,226,694 | 850,624 | 2,077,318 | -376,071 |
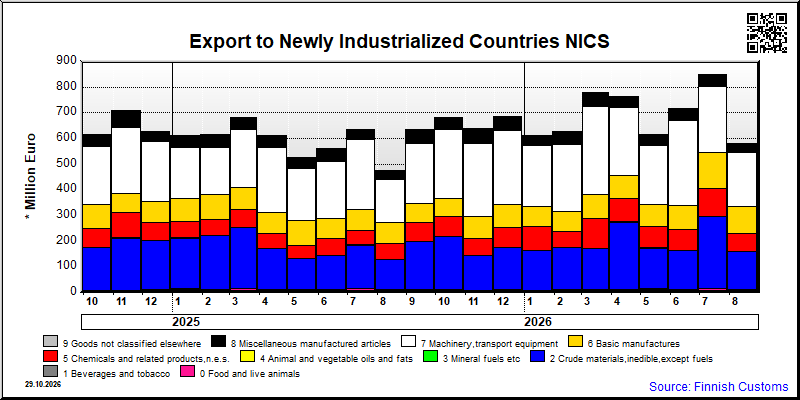
| 2026/3 | 2026/4 | 2026/5 | 2026/6 | 2026/7 | ||||||
|---|---|---|---|---|---|---|---|---|---|---|
| 1000 € | % | 1000 € | % | 1000 € | % | 1000 € | % | 1000 € | % | |
| 0. Food and live animals | 10,989 | 1.4 | 12,052 | 1.6 | 13,598 | 2.2 | 12,936 | 1.8 | 13,909 | 1.6 |
| 1. Beverages and tobacco | 93 | 0.0 | 94 | 0.0 | 120 | 0.0 | 134 | 0.0 | 289 | 0.0 |
| 2. Crude materials,inedible,except fuels | 159,574 | 20.5 | 261,865 | 34.3 | 159,439 | 25.8 | 150,836 | 21.0 | 281,395 | 33.1 |
| 3. Mineral fuels etc | 678 | 0.1 | 1,188 | 0.2 | 977 | 0.2 | 1,068 | 0.1 | 789 | 0.1 |
| 4. Animal and vegetable oils and fats | 13 | 0.0 | 36 | 0.0 | 8 | 0.0 | 14 | 0.0 | ||
| 5. Chemicals and related products,n.e.s. | 118,880 | 15.3 | 89,608 | 11.7 | 82,275 | 13.3 | 81,314 | 11.3 | 108,740 | 12.8 |
| 6. Basic manufactures | 89,876 | 11.6 | 89,660 | 11.7 | 87,837 | 14.2 | 91,826 | 12.8 | 140,525 | 16.5 |
| 7. Machinery,transport equipment | 343,471 | 44.1 | 268,358 | 35.2 | 228,206 | 36.9 | 331,736 | 46.2 | 256,931 | 30.2 |
| 8. Miscellaneous manufactured articles | 54,563 | 7.0 | 40,246 | 5.3 | 45,478 | 7.4 | 47,462 | 6.6 | 48,033 | 5.6 |
| All groups combined | 778,125 | 100.0 | 763,084 | 100.0 | 617,968 | 100.0 | 717,320 | 100.0 | 850,624 | 100.0 |
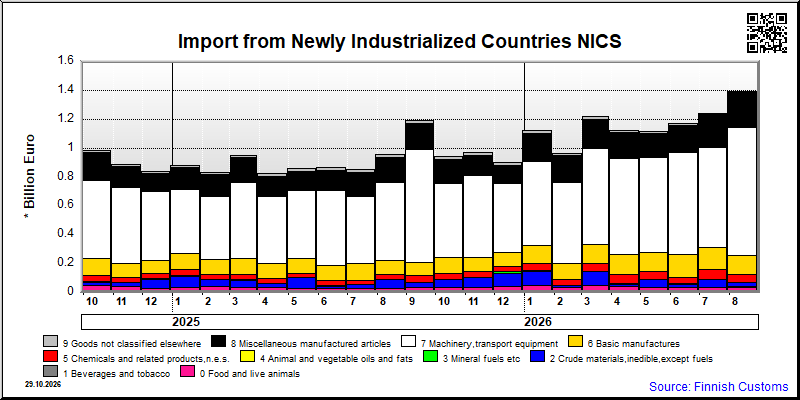
| 2026/3 | 2026/4 | 2026/5 | 2026/6 | 2026/7 | ||||||
|---|---|---|---|---|---|---|---|---|---|---|
| 1000 € | % | 1000 € | % | 1000 € | % | 1000 € | % | 1000 € | % | |
| 0. Food and live animals | 45,191 | 3.7 | 39,688 | 3.5 | 34,702 | 3.1 | 33,499 | 2.9 | 33,265 | 2.7 |
| 1. Beverages and tobacco | 1,003 | 0.1 | 933 | 0.1 | 1,158 | 0.1 | 1,324 | 0.1 | 1,082 | 0.1 |
| 2. Crude materials,inedible,except fuels | 96,482 | 7.9 | 31,905 | 2.8 | 54,896 | 5.0 | 25,058 | 2.1 | 44,866 | 3.7 |
| 3. Mineral fuels etc | 84 | 0.0 | 50 | 0.0 | 161 | 0.0 | 148 | 0.0 | 628 | 0.1 |
| 4. Animal and vegetable oils and fats | 3,665 | 0.3 | 4,260 | 0.4 | 2,703 | 0.2 | 195 | 0.0 | 217 | 0.0 |
| 5. Chemicals and related products,n.e.s. | 54,858 | 4.5 | 66,440 | 5.8 | 53,887 | 4.9 | 42,775 | 3.7 | 69,610 | 5.7 |
| 6. Basic manufactures | 128,227 | 10.5 | 138,645 | 12.2 | 129,272 | 11.7 | 165,028 | 14.1 | 150,957 | 12.3 |
| 7. Machinery,transport equipment | 668,357 | 54.9 | 662,948 | 58.3 | 651,346 | 58.8 | 699,859 | 59.8 | 690,589 | 56.3 |
| 8. Miscellaneous manufactured articles | 202,948 | 16.7 | 177,555 | 15.6 | 164,240 | 14.8 | 185,386 | 15.8 | 225,221 | 18.4 |
| 9. Goods not classified elsewhere | 15,658 | 1.3 | 14,690 | 1.3 | 16,072 | 1.5 | 16,460 | 1.4 | 10,259 | 0.8 |
| All groups combined | 1,216,473 | 100.0 | 1,137,114 | 100.0 | 1,108,436 | 100.0 | 1,169,733 | 100.0 | 1,226,694 | 100.0 |
| Classification | Description | Year level | Quarter level | Month level | Year 2026 sofar |
|---|---|---|---|---|---|
| SITC | Standard International Trade Classification (classification system is maintained by the United Nations) | ███ | ███ | ███ | ███ |
| BEC | The standard of statistical classification of BEC (Broad Economic Categories) is upheld by the UN and it is based on SITC-nomenclature. | ███ | ███ | ███ | ███ |
| NACE | National industrial classification based on Statistical Classification of Economic Activities in the European Community Nomenclature générale des Activités économiques dans les Communautés européennes | ███ | ███ | ███ | ███ |
| CPA | CPA = Classification of Products by Activities | ███ | ███ | ███ | ███ |
| CN | The Combined Nomenclature is the common nomenclature of the European Community. | ███ | ███ | ███ | ███ |