
| Export of goods from Finland and import to Finland | BEC (Broad Economic Categories) |
*) The standard of statistical classification of BEC (Broad Economic Categories) is upheld by the UN and it is based on SITC-nomenclature.
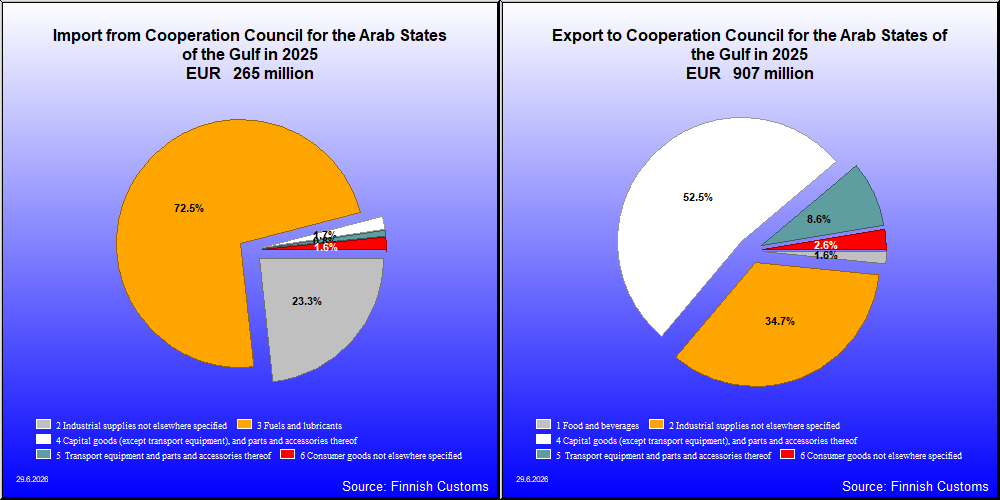

| 2021 | 2022 | 2023 | 2024 | 2025 | ||||||
|---|---|---|---|---|---|---|---|---|---|---|
| 1,000 € | % | 1,000 € | % | 1,000 € | % | 1,000 € | % | 1,000 € | % | |
| 1. Food and beverages | 13,590 | 2.6 | 14,745 | 2.2 | 17,766 | 2.4 | 12,819 | 1.7 | 14,250 | 1.6 |
| 11. Food and beverages, primary | 757 | 0.1 | 1,502 | 0.2 | 1,464 | 0.2 | 342 | 0.0 | 549 | 0.1 |
| 111. Food and beverages, primary, mainly for industry | 7 | 0.0 | 12 | 0.0 | 4 | 0.0 | 2 | 0.0 | 3 | 0.0 |
| 112. Food and beverages, primary, mainly for household consumption | 750 | 0.1 | 1,490 | 0.2 | 1,460 | 0.2 | 340 | 0.0 | 546 | 0.1 |
| 12. Food and beverages, processed | 12,833 | 2.4 | 13,244 | 1.9 | 16,302 | 2.2 | 12,477 | 1.7 | 13,701 | 1.5 |
| 121. Food and beverages, processed, mainly for industry | 7,148 | 1.3 | 6,788 | 1.0 | 6,674 | 0.9 | 3,661 | 0.5 | 2,749 | 0.3 |
| 122. Food and beverages, processed, mainly for household consumption | 5,685 | 1.1 | 6,455 | 0.9 | 9,628 | 1.3 | 8,816 | 1.2 | 10,952 | 1.2 |
| 2. Industrial supplies not elsewhere specified | 275,343 | 51.7 | 292,744 | 42.8 | 258,606 | 34.6 | 279,480 | 37.6 | 313,820 | 34.6 |
| 21. Industrial supplies not elsewhere specified, primary | 2,251 | 0.4 | 3,670 | 0.5 | 4,368 | 0.6 | 4,289 | 0.6 | 2,745 | 0.3 |
| 22. Industrial supplies not elsewhere specified, processed | 273,092 | 51.3 | 289,074 | 42.3 | 254,238 | 34.0 | 275,191 | 37.0 | 311,075 | 34.3 |
| 3. Fuels and lubricants | 995 | 0.2 | 600 | 0.1 | 226 | 0.0 | 214 | 0.0 | 310 | 0.0 |
| 31. Fuels and lubricants, primary | 61 | 0.0 | 40 | 0.0 | 48 | 0.0 | 33 | 0.0 | 31 | 0.0 |
| 32. Fuels and lubricants, processed | 934 | 0.2 | 560 | 0.1 | 179 | 0.0 | 181 | 0.0 | 279 | 0.0 |
| 321. Fuels and lubricants, motor spirit | 860 | 0.2 | 4 | 0.0 | 43 | 0.0 | 220 | 0.0 | ||
| 322. Fuels and lubricants, other | 74 | 0.0 | 555 | 0.1 | 179 | 0.0 | 138 | 0.0 | 59 | 0.0 |
| 4. Capital goods (except transport equipment), and parts and accessories thereof | 216,305 | 40.6 | 250,907 | 36.7 | 334,162 | 44.7 | 399,402 | 53.7 | 475,521 | 52.4 |
| 41. Capital goods (except transport equipment) | 132,218 | 24.8 | 167,678 | 24.5 | 225,133 | 30.1 | 262,352 | 35.3 | 328,337 | 36.2 |
| 42. Capital goods (except transport equipment), parts and accessories | 84,087 | 15.8 | 83,229 | 12.2 | 109,029 | 14.6 | 137,051 | 18.4 | 147,184 | 16.2 |
| 5. Transport equipment and parts and accessories thereof | 13,894 | 2.6 | 106,881 | 15.6 | 120,676 | 16.1 | 30,098 | 4.0 | 77,632 | 8.6 |
| 51. Passenger motor vehicles | 175 | 0.0 | 19 | 0.0 | 443 | 0.1 | 74 | 0.0 | 736 | 0.1 |
| 52. Transport equipment, other than passenger motor vehicles | 7,386 | 1.4 | 102,407 | 15.0 | 110,473 | 14.8 | 16,607 | 2.2 | 61,491 | 6.8 |
| 521. Transport equipment, other than passenger motor vehicles, industrial | 7,028 | 1.3 | 102,364 | 15.0 | 109,987 | 14.7 | 15,851 | 2.1 | 60,297 | 6.6 |
| 522. Transport equipment, other than passenger motor vehicles, non-industrial | 359 | 0.1 | 43 | 0.0 | 486 | 0.1 | 757 | 0.1 | 1,195 | 0.1 |
| 53. Transport equipment, parts and accessories | 6,333 | 1.2 | 4,455 | 0.7 | 9,760 | 1.3 | 13,417 | 1.8 | 15,406 | 1.7 |
| 6. Consumer goods not elsewhere specified | 11,031 | 2.1 | 13,717 | 2.0 | 15,367 | 2.1 | 20,621 | 2.8 | 23,833 | 2.6 |
| 61. Consumer goods not elsewhere specified, durable | 2,175 | 0.4 | 2,901 | 0.4 | 1,957 | 0.3 | 1,214 | 0.2 | 2,465 | 0.3 |
| 62. Consumer goods not elsewhere specified, semi-durable | 2,653 | 0.5 | 5,176 | 0.8 | 6,008 | 0.8 | 8,754 | 1.2 | 10,269 | 1.1 |
| 63. Consumer goods not elsewhere specified, non-durable | 6,204 | 1.2 | 5,640 | 0.8 | 7,402 | 1.0 | 10,654 | 1.4 | 11,098 | 1.2 |
| 7. Goods not elsewhere specified | 1,207 | 0.2 | 3,942 | 0.6 | 874 | 0.1 | 762 | 0.1 | 2,019 | 0.2 |
| All groups | 532,366 | 100.0 | 683,535 | 100.0 | 747,677 | 100.0 | 743,397 | 100.0 | 907,385 | 100.0 |
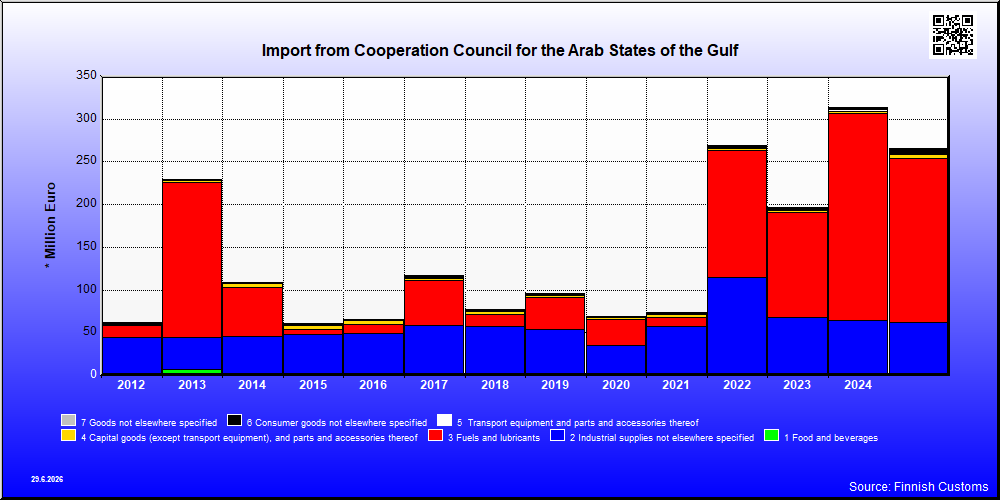
| 2021 | 2022 | 2023 | 2024 | 2025 | ||||||
|---|---|---|---|---|---|---|---|---|---|---|
| 1,000 € | % | 1,000 € | % | 1,000 € | % | 1,000 € | % | 1,000 € | % | |
| 1. Food and beverages | 593 | 0.8 | 360 | 0.1 | 157 | 0.1 | 164 | 0.1 | 299 | 0.1 |
| 11. Food and beverages, primary | 32 | 0.0 | 11 | 0.0 | 48 | 0.0 | 130 | 0.0 | 220 | 0.1 |
| 111. Food and beverages, primary, mainly for industry | 1 | 0.0 | 2 | 0.0 | 2 | 0.0 | 1 | 0.0 | ||
| 112. Food and beverages, primary, mainly for household consumption | 31 | 0.0 | 11 | 0.0 | 46 | 0.0 | 128 | 0.0 | 219 | 0.1 |
| 12. Food and beverages, processed | 561 | 0.8 | 349 | 0.1 | 109 | 0.1 | 34 | 0.0 | 79 | 0.0 |
| 121. Food and beverages, processed, mainly for industry | 439 | 0.6 | 337 | 0.1 | 11 | 0.0 | 1 | 0.0 | 5 | 0.0 |
| 122. Food and beverages, processed, mainly for household consumption | 122 | 0.2 | 11 | 0.0 | 98 | 0.0 | 33 | 0.0 | 75 | 0.0 |
| 2. Industrial supplies not elsewhere specified | 56,685 | 77.1 | 114,093 | 42.4 | 67,498 | 34.4 | 64,018 | 20.4 | 61,703 | 23.3 |
| 21. Industrial supplies not elsewhere specified, primary | 6,482 | 8.8 | 17,262 | 6.4 | 8,775 | 4.5 | 8,489 | 2.7 | 5,169 | 1.9 |
| 22. Industrial supplies not elsewhere specified, processed | 50,203 | 68.3 | 96,831 | 36.0 | 58,723 | 29.9 | 55,530 | 17.7 | 56,534 | 21.3 |
| 3. Fuels and lubricants | 10,945 | 14.9 | 149,084 | 55.4 | 123,443 | 62.9 | 242,469 | 77.2 | 191,738 | 72.3 |
| 32. Fuels and lubricants, processed | 10,945 | 14.9 | 149,084 | 55.4 | 123,443 | 62.9 | 242,469 | 77.2 | 191,738 | 72.3 |
| 321. Fuels and lubricants, motor spirit | 10,945 | 14.9 | ||||||||
| 322. Fuels and lubricants, other | 149,084 | 55.4 | 123,443 | 62.9 | 242,469 | 77.2 | 191,738 | 72.3 | ||
| 4. Capital goods (except transport equipment), and parts and accessories thereof | 2,669 | 3.6 | 2,041 | 0.8 | 1,942 | 1.0 | 2,796 | 0.9 | 4,625 | 1.7 |
| 41. Capital goods (except transport equipment) | 1,254 | 1.7 | 1,538 | 0.6 | 1,337 | 0.7 | 1,213 | 0.4 | 2,580 | 1.0 |
| 42. Capital goods (except transport equipment), parts and accessories | 1,416 | 1.9 | 503 | 0.2 | 605 | 0.3 | 1,583 | 0.5 | 2,045 | 0.8 |
| 5. Transport equipment and parts and accessories thereof | 1,238 | 1.7 | 1,109 | 0.4 | 1,454 | 0.7 | 2,300 | 0.7 | 2,058 | 0.8 |
| 51. Passenger motor vehicles | 156 | 0.2 | 217 | 0.1 | 135 | 0.1 | 54 | 0.0 | 59 | 0.0 |
| 52. Transport equipment, other than passenger motor vehicles | 349 | 0.5 | 93 | 0.0 | 62 | 0.0 | 159 | 0.1 | 44 | 0.0 |
| 521. Transport equipment, other than passenger motor vehicles, industrial | 349 | 0.5 | 93 | 0.0 | 47 | 0.0 | 158 | 0.1 | 44 | 0.0 |
| 522. Transport equipment, other than passenger motor vehicles, non-industrial | 15 | 0.0 | 1 | 0.0 | ||||||
| 53. Transport equipment, parts and accessories | 733 | 1.0 | 798 | 0.3 | 1,256 | 0.6 | 2,087 | 0.7 | 1,954 | 0.7 |
| 6. Consumer goods not elsewhere specified | 583 | 0.8 | 1,863 | 0.7 | 1,460 | 0.7 | 1,889 | 0.6 | 4,347 | 1.6 |
| 61. Consumer goods not elsewhere specified, durable | 28 | 0.0 | 98 | 0.0 | 147 | 0.1 | 89 | 0.0 | 443 | 0.2 |
| 62. Consumer goods not elsewhere specified, semi-durable | 335 | 0.5 | 1,584 | 0.6 | 892 | 0.5 | 936 | 0.3 | 945 | 0.4 |
| 63. Consumer goods not elsewhere specified, non-durable | 220 | 0.3 | 181 | 0.1 | 420 | 0.2 | 864 | 0.3 | 2,959 | 1.1 |
| 7. Goods not elsewhere specified | 773 | 1.1 | 489 | 0.2 | 270 | 0.1 | 288 | 0.1 | 608 | 0.2 |
| All groups | 73,487 | 100.0 | 269,038 | 100.0 | 196,224 | 100.0 | 313,924 | 100.0 | 265,377 | 100.0 |
| Classification | Description | Year level | Quarter level | Month level | |
|---|---|---|---|---|---|
| SITC | Standard International Trade Classification (classification system is maintained by the United Nations) | ███ | ███ | ███ | |
| BEC | The standard of statistical classification of BEC (Broad Economic Categories) is upheld by the UN and it is based on SITC-nomenclature. | ███ | ███ | ███ | |
| NACE | National industrial classification based on Statistical Classification of Economic Activities in the European Community Nomenclature générale des Activités économiques dans les Communautés européennes | ███ | ███ | ███ | |
| CPA | CPA = Classification of Products by Activities | ███ | ███ | ███ | |
| CN | The Combined Nomenclature is the common nomenclature of the European Community. | ███ | ███ | ███ |