
| Export of goods from Finland and import to Finland | Trade Balance |
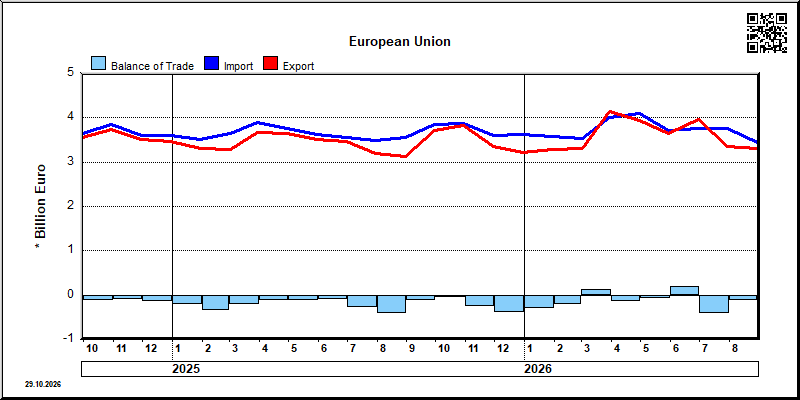
| Year | Month | Import 1,000 € | Export 1,000 € | Trade 1,000 € | Trade Balance 1,000 € |
|---|---|---|---|---|---|
| 2023 | 1 | 3,708,264 | 3,498,278 | 7,206,543 | -209,986 |
| 2023 | 2 | 3,498,894 | 2,929,706 | 6,428,600 | -569,187 |
| 2023 | 3 | 4,590,576 | 4,495,030 | 9,085,606 | -95,547 |
| 2023 | 4 | 3,647,528 | 3,610,941 | 7,258,469 | -36,587 |
| 2023 | 5 | 3,959,449 | 3,632,017 | 7,591,466 | -327,432 |
| 2023 | 6 | 3,762,442 | 3,503,876 | 7,266,318 | -258,566 |
| 2023 | 7 | 3,253,655 | 2,932,201 | 6,185,856 | -321,454 |
| 2023 | 8 | 3,494,251 | 3,427,791 | 6,922,042 | -66,461 |
| 2023 | 9 | 3,597,286 | 3,601,077 | 7,198,363 | 3,790 |
| 2023 | 10 | 3,769,709 | 3,622,103 | 7,391,812 | -147,606 |
| 2023 | 11 | 3,783,108 | 3,630,021 | 7,413,128 | -153,087 |
| 2023 | 12 | 3,336,568 | 3,185,619 | 6,522,187 | -150,948 |
| 2024 | 1 | 3,521,930 | 3,181,261 | 6,703,190 | -340,669 |
| 2024 | 2 | 3,570,064 | 3,017,246 | 6,587,311 | -552,818 |
| 2024 | 3 | 3,422,164 | 3,066,896 | 6,489,060 | -355,268 |
| 2024 | 4 | 4,037,165 | 3,405,568 | 7,442,733 | -631,597 |
| 2024 | 5 | 3,941,914 | 3,411,868 | 7,353,781 | -530,046 |
| 2024 | 6 | 3,370,145 | 4,015,076 | 7,385,221 | 644,931 |
| 2024 | 7 | 3,617,459 | 3,293,950 | 6,911,409 | -323,509 |
| 2024 | 8 | 3,501,831 | 3,268,267 | 6,770,098 | -233,565 |
| 2024 | 9 | 3,644,926 | 3,549,276 | 7,194,202 | -95,651 |
| 2024 | 10 | 3,843,905 | 3,730,878 | 7,574,783 | -113,026 |
| 2024 | 11 | 3,601,050 | 3,503,008 | 7,104,058 | -98,041 |
| 2024 | 12 | 3,597,583 | 3,459,361 | 7,056,944 | -138,222 |
| 2025 | 1 | 3,511,835 | 3,299,287 | 6,811,122 | -212,548 |
| 2025 | 2 | 3,651,264 | 3,296,624 | 6,947,888 | -354,640 |
| 2025 | 3 | 3,888,088 | 3,674,143 | 7,562,231 | -213,946 |
| 2025 | 4 | 3,755,860 | 3,641,375 | 7,397,235 | -114,485 |
| 2025 | 5 | 3,628,811 | 3,516,013 | 7,144,824 | -112,798 |
| 2025 | 6 | 3,550,546 | 3,461,895 | 7,012,442 | -88,651 |
| 2025 | 7 | 3,487,476 | 3,199,457 | 6,686,933 | -288,020 |
| 2025 | 8 | 3,546,648 | 3,135,907 | 6,682,554 | -410,741 |
| 2025 | 9 | 3,851,379 | 3,720,494 | 7,571,872 | -130,885 |
| 2025 | 10 | 3,880,131 | 3,834,599 | 7,714,731 | -45,532 |
| 2025 | 11 | 3,604,088 | 3,353,182 | 6,957,270 | -250,907 |
| 2025 | 12 | 3,623,174 | 3,222,266 | 6,845,441 | -400,908 |
| 2026 | 1 | 3,566,369 | 3,275,729 | 6,842,098 | -290,640 |
| 2026 | 2 | 3,530,319 | 3,315,693 | 6,846,012 | -214,626 |
| 2026 | 3 | 3,997,863 | 4,140,564 | 8,138,427 | 142,701 |
| 2026 | 4 | 4,078,369 | 3,946,097 | 8,024,466 | -132,272 |
| 2026 | 5 | 3,698,465 | 3,648,193 | 7,346,657 | -50,272 |
| 2026 | 6 | 3,770,869 | 3,961,356 | 7,732,225 | 190,488 |
| 2026 | 7 | 3,685,231 | 3,345,218 | 7,030,449 | -340,014 |
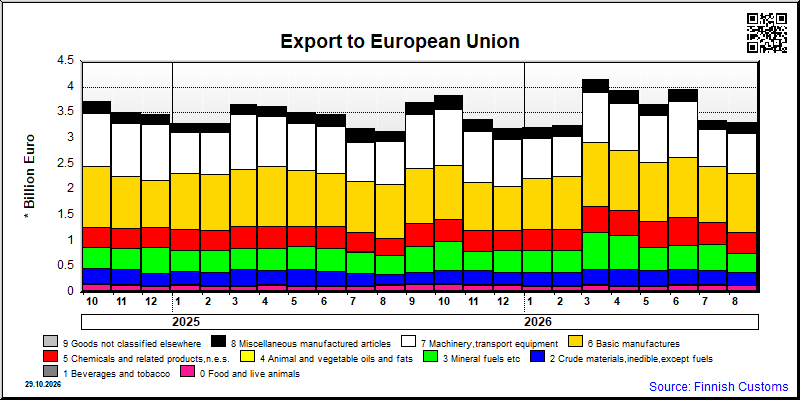
| 2026/3 | 2026/4 | 2026/5 | 2026/6 | 2026/7 | ||||||
|---|---|---|---|---|---|---|---|---|---|---|
| 1000 € | % | 1000 € | % | 1000 € | % | 1000 € | % | 1000 € | % | |
| 0. Food and live animals | 132,806 | 3.2 | 121,226 | 3.1 | 125,899 | 3.5 | 135,467 | 3.4 | 128,098 | 3.8 |
| 1. Beverages and tobacco | 17,206 | 0.4 | 21,348 | 0.5 | 19,358 | 0.5 | 19,084 | 0.5 | 19,949 | 0.6 |
| 2. Crude materials,inedible,except fuels | 291,625 | 7.0 | 299,642 | 7.6 | 279,147 | 7.7 | 300,845 | 7.6 | 268,573 | 8.0 |
| 3. Mineral fuels etc | 717,531 | 17.3 | 674,498 | 17.1 | 456,196 | 12.5 | 459,790 | 11.6 | 512,213 | 15.3 |
| 4. Animal and vegetable oils and fats | 6,609 | 0.2 | 2,620 | 0.1 | 2,027 | 0.1 | 2,519 | 0.1 | 1,862 | 0.1 |
| 5. Chemicals and related products,n.e.s. | 514,491 | 12.4 | 477,007 | 12.1 | 493,091 | 13.5 | 541,960 | 13.7 | 431,675 | 12.9 |
| 6. Basic manufactures | 1,239,040 | 29.9 | 1,164,439 | 29.5 | 1,162,932 | 31.9 | 1,161,421 | 29.3 | 1,079,936 | 32.3 |
| 7. Machinery,transport equipment | 969,021 | 23.4 | 929,242 | 23.5 | 899,594 | 24.7 | 1,093,831 | 27.6 | 722,637 | 21.6 |
| 8. Miscellaneous manufactured articles | 234,064 | 5.7 | 239,894 | 6.1 | 193,906 | 5.3 | 233,550 | 5.9 | 166,743 | 5.0 |
| 9. Goods not classified elsewhere | 18,172 | 0.4 | 16,179 | 0.4 | 16,045 | 0.4 | 12,889 | 0.3 | 13,532 | 0.4 |
| All groups combined | 4,140,564 | 100.0 | 3,946,097 | 100.0 | 3,648,193 | 100.0 | 3,961,356 | 100.0 | 3,345,218 | 100.0 |

| 2026/3 | 2026/4 | 2026/5 | 2026/6 | 2026/7 | ||||||
|---|---|---|---|---|---|---|---|---|---|---|
| 1000 € | % | 1000 € | % | 1000 € | % | 1000 € | % | 1000 € | % | |
| 0. Food and live animals | 371,252 | 9.3 | 382,999 | 9.4 | 351,746 | 9.5 | 363,598 | 9.6 | 344,066 | 9.3 |
| 1. Beverages and tobacco | 52,381 | 1.3 | 51,723 | 1.3 | 50,530 | 1.4 | 63,745 | 1.7 | 55,431 | 1.5 |
| 2. Crude materials,inedible,except fuels | 338,463 | 8.5 | 294,851 | 7.2 | 281,852 | 7.6 | 243,026 | 6.4 | 238,878 | 6.5 |
| 3. Mineral fuels etc | 399,048 | 10.0 | 548,022 | 13.4 | 337,209 | 9.1 | 287,807 | 7.6 | 404,046 | 11.0 |
| 4. Animal and vegetable oils and fats | 24,608 | 0.6 | 26,641 | 0.7 | 29,812 | 0.8 | 30,976 | 0.8 | 21,455 | 0.6 |
| 5. Chemicals and related products,n.e.s. | 495,278 | 12.4 | 526,821 | 12.9 | 482,743 | 13.1 | 523,350 | 13.9 | 484,121 | 13.1 |
| 6. Basic manufactures | 703,639 | 17.6 | 762,356 | 18.7 | 701,959 | 19.0 | 704,752 | 18.7 | 612,029 | 16.6 |
| 7. Machinery,transport equipment | 1,333,737 | 33.4 | 1,211,169 | 29.7 | 1,198,805 | 32.4 | 1,278,483 | 33.9 | 1,231,411 | 33.4 |
| 8. Miscellaneous manufactured articles | 270,689 | 6.8 | 257,927 | 6.3 | 257,560 | 7.0 | 267,325 | 7.1 | 258,767 | 7.0 |
| 9. Goods not classified elsewhere | 8,768 | 0.2 | 15,860 | 0.4 | 6,247 | 0.2 | 7,806 | 0.2 | 35,026 | 1.0 |
| All groups combined | 3,997,863 | 100.0 | 4,078,369 | 100.0 | 3,698,465 | 100.0 | 3,770,869 | 100.0 | 3,685,231 | 100.0 |
| Classification | Description | Year level | Quarter level | Month level | Year 2026 sofar |
|---|---|---|---|---|---|
| SITC | Standard International Trade Classification (classification system is maintained by the United Nations) | ███ | ███ | ███ | ███ |
| BEC | The standard of statistical classification of BEC (Broad Economic Categories) is upheld by the UN and it is based on SITC-nomenclature. | ███ | ███ | ███ | ███ |
| NACE | National industrial classification based on Statistical Classification of Economic Activities in the European Community Nomenclature générale des Activités économiques dans les Communautés européennes | ███ | ███ | ███ | ███ |
| CPA | CPA = Classification of Products by Activities | ███ | ███ | ███ | ███ |
| CN | The Combined Nomenclature is the common nomenclature of the European Community. | ███ | ███ | ███ | ███ |