
| Export of goods from Finland and import to Finland | BEC (Broad Economic Categories) |
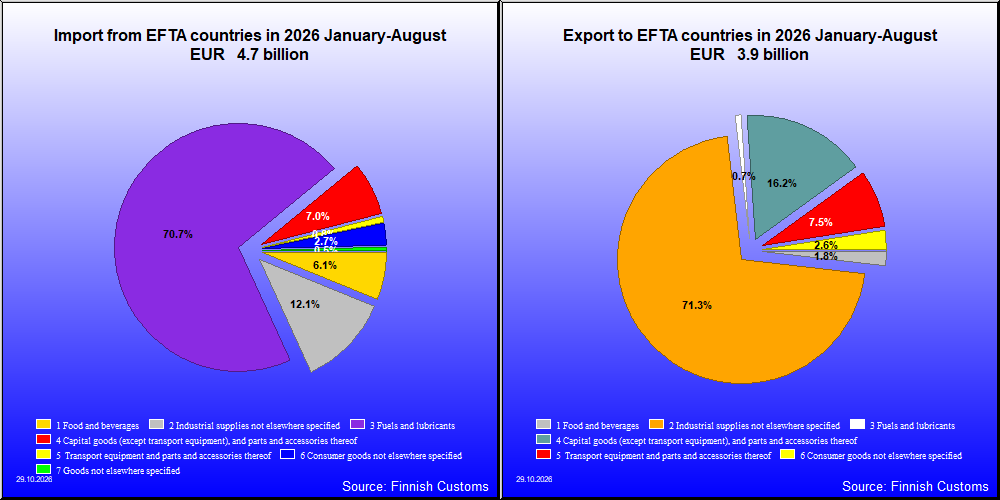
| 2026 1-8 1,000 € | 2025 1-8 1,000 € | Change % |
|
|---|---|---|---|
| 1. Food and beverages | 72,516 | 46,096 | 57.3 |
| 11. Food and beverages, primary | 3,127 | 5,929 | -47.3 |
| 111. Food and beverages, primary, mainly for industry | 1,071 | 1,879 | -43.0 |
| 112. Food and beverages, primary, mainly for household consumption | 2,056 | 4,050 | -49.2 |
| 12. Food and beverages, processed | 69,390 | 40,167 | 72.8 |
| 121. Food and beverages, processed, mainly for industry | 31,007 | 3,709 | 736.0 |
| 122. Food and beverages, processed, mainly for household consumption | 38,383 | 36,458 | 5.3 |
| 2. Industrial supplies not elsewhere specified | 2,794,752 | 1,934,056 | 44.5 |
| 21. Industrial supplies not elsewhere specified, primary | 691,166 | 522,906 | 32.2 |
| 22. Industrial supplies not elsewhere specified, processed | 2,103,586 | 1,411,149 | 49.1 |
| 3. Fuels and lubricants | 26,019 | 46,936 | -44.6 |
| 31. Fuels and lubricants, primary | 281 | 303 | -7.1 |
| 32. Fuels and lubricants, processed | 25,738 | 46,633 | -44.8 |
| 321. Fuels and lubricants, motor spirit | 0 | 14,681 | .. |
| 322. Fuels and lubricants, other | 25,738 | 31,952 | -19.4 |
| 4. Capital goods (except transport equipment), and parts and accessories thereof | 633,571 | 546,946 | 15.8 |
| 41. Capital goods (except transport equipment) | 483,704 | 417,081 | 16.0 |
| 42. Capital goods (except transport equipment), parts and accessories | 149,867 | 129,865 | 15.4 |
| 5. Transport equipment and parts and accessories thereof | 292,872 | 265,508 | 10.3 |
| 51. Passenger motor vehicles | 4,528 | 3,160 | 43.3 |
| 52. Transport equipment, other than passenger motor vehicles | 189,980 | 172,120 | 10.4 |
| 521. Transport equipment, other than passenger motor vehicles, industrial | 121,732 | 142,218 | -14.4 |
| 522. Transport equipment, other than passenger motor vehicles, non-industrial | 68,248 | 29,929 | 128.0 |
| 53. Transport equipment, parts and accessories | 98,364 | 90,229 | 9.0 |
| 6. Consumer goods not elsewhere specified | 100,716 | 96,442 | 4.4 |
| 61. Consumer goods not elsewhere specified, durable | 16,692 | 14,935 | 11.8 |
| 62. Consumer goods not elsewhere specified, semi-durable | 47,215 | 53,743 | -12.1 |
| 63. Consumer goods not elsewhere specified, non-durable | 36,809 | 27,765 | 32.6 |
| 7. Goods not elsewhere specified | 10,082 | 1,691 | 496.2 |
| All groups | 3,930,529 | 2,937,675 | 33.8 |
| 2026 1-8 1,000 € | 2025 1-8 1,000 € | Change % |
|
|---|---|---|---|
| 1. Food and beverages | 285,247 | 238,180 | 19.8 |
| 11. Food and beverages, primary | 195,624 | 174,044 | 12.4 |
| 111. Food and beverages, primary, mainly for industry | 203 | 128 | 58.9 |
| 112. Food and beverages, primary, mainly for household consumption | 195,421 | 173,916 | 12.4 |
| 12. Food and beverages, processed | 89,622 | 64,135 | 39.7 |
| 121. Food and beverages, processed, mainly for industry | 3,001 | 7,825 | -61.6 |
| 122. Food and beverages, processed, mainly for household consumption | 86,621 | 56,310 | 53.8 |
| 2. Industrial supplies not elsewhere specified | 568,573 | 520,231 | 9.3 |
| 21. Industrial supplies not elsewhere specified, primary | 49,597 | 43,689 | 13.5 |
| 22. Industrial supplies not elsewhere specified, processed | 518,977 | 476,541 | 8.9 |
| 3. Fuels and lubricants | 3,310,946 | 2,930,193 | 13.0 |
| 31. Fuels and lubricants, primary | 3,145,278 | 2,810,714 | 11.9 |
| 32. Fuels and lubricants, processed | 165,668 | 119,479 | 38.7 |
| 321. Fuels and lubricants, motor spirit | 0 | 12 | .. |
| 322. Fuels and lubricants, other | 165,668 | 119,467 | 38.7 |
| 4. Capital goods (except transport equipment), and parts and accessories thereof | 327,714 | 248,454 | 31.9 |
| 41. Capital goods (except transport equipment) | 220,488 | 174,102 | 26.6 |
| 42. Capital goods (except transport equipment), parts and accessories | 107,226 | 74,352 | 44.2 |
| 5. Transport equipment and parts and accessories thereof | 37,313 | 32,914 | 13.4 |
| 51. Passenger motor vehicles | 295 | 366 | -19.5 |
| 52. Transport equipment, other than passenger motor vehicles | 25,483 | 21,141 | 20.5 |
| 521. Transport equipment, other than passenger motor vehicles, industrial | 23,761 | 20,730 | 14.6 |
| 522. Transport equipment, other than passenger motor vehicles, non-industrial | 1,723 | 411 | 318.6 |
| 53. Transport equipment, parts and accessories | 11,534 | 11,406 | 1.1 |
| 6. Consumer goods not elsewhere specified | 128,574 | 136,236 | -5.6 |
| 61. Consumer goods not elsewhere specified, durable | 30,705 | 29,211 | 5.1 |
| 62. Consumer goods not elsewhere specified, semi-durable | 18,702 | 26,151 | -28.5 |
| 63. Consumer goods not elsewhere specified, non-durable | 79,166 | 80,873 | -2.1 |
| 7. Goods not elsewhere specified | 25,739 | 17,328 | 48.5 |
| All groups | 4,684,106 | 4,123,536 | 13.6 |
| Classification | Description | Year level | Quarter level | Month level | Year 2026 sofar |
|---|---|---|---|---|---|
| SITC | Standard International Trade Classification (classification system is maintained by the United Nations) | ███ | ███ | ███ | ███ |
| BEC | The standard of statistical classification of BEC (Broad Economic Categories) is upheld by the UN and it is based on SITC-nomenclature. | ███ | ███ | ███ | ███ |
| NACE | National industrial classification based on Statistical Classification of Economic Activities in the European Community Nomenclature générale des Activités économiques dans les Communautés européennes | ███ | ███ | ███ | ███ |
| CPA | CPA = Classification of Products by Activities | ███ | ███ | ███ | ███ |
| CN | The Combined Nomenclature is the common nomenclature of the European Community. | ███ | ███ | ███ | ███ |