
| Export of goods from Finland and import to Finland | BEC (Broad Economic Categories) |
*) The standard of statistical classification of BEC (Broad Economic Categories) is upheld by the UN and it is based on SITC-nomenclature.
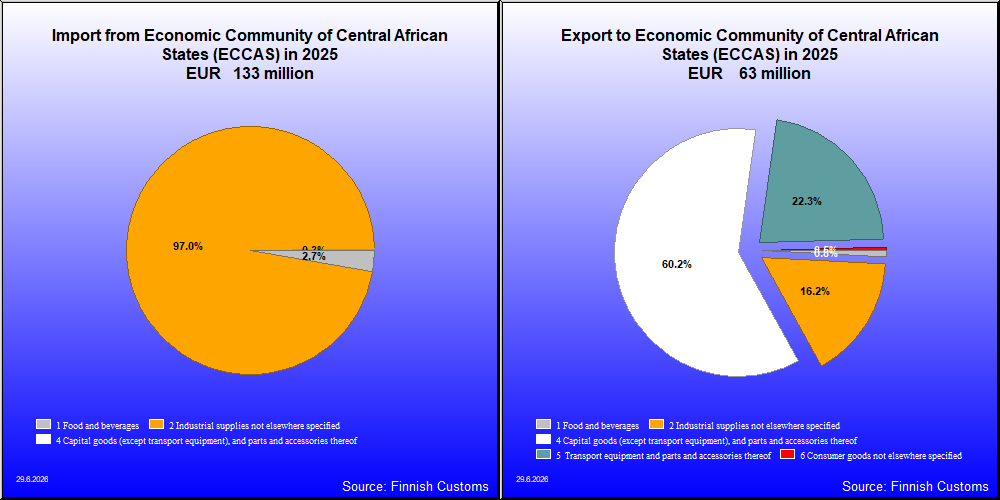

| 2021 | 2022 | 2023 | 2024 | 2025 | ||||||
|---|---|---|---|---|---|---|---|---|---|---|
| 1,000 € | % | 1,000 € | % | 1,000 € | % | 1,000 € | % | 1,000 € | % | |
| 1. Food and beverages | 479 | 1.1 | 429 | 0.7 | 715 | 0.6 | 518 | 0.8 | 477 | 0.8 |
| 12. Food and beverages, processed | 479 | 1.1 | 429 | 0.7 | 715 | 0.6 | 518 | 0.8 | 477 | 0.8 |
| 121. Food and beverages, processed, mainly for industry | 85 | 0.1 | ||||||||
| 122. Food and beverages, processed, mainly for household consumption | 479 | 1.1 | 344 | 0.6 | 715 | 0.6 | 517 | 0.8 | 477 | 0.8 |
| 2. Industrial supplies not elsewhere specified | 7,693 | 18.3 | 13,479 | 21.8 | 38,671 | 33.4 | 7,688 | 11.9 | 10,185 | 16.2 |
| 21. Industrial supplies not elsewhere specified, primary | 229 | 0.5 | 345 | 0.6 | 360 | 0.3 | 276 | 0.4 | 72 | 0.1 |
| 22. Industrial supplies not elsewhere specified, processed | 7,464 | 17.7 | 13,134 | 21.3 | 38,311 | 33.1 | 7,412 | 11.5 | 10,114 | 16.1 |
| 3. Fuels and lubricants | 1 | 0.0 | ||||||||
| 32. Fuels and lubricants, processed | 1 | 0.0 | ||||||||
| 322. Fuels and lubricants, other | 1 | 0.0 | ||||||||
| 4. Capital goods (except transport equipment), and parts and accessories thereof | 24,129 | 57.3 | 39,857 | 64.5 | 67,038 | 57.9 | 36,209 | 56.0 | 37,818 | 60.2 |
| 41. Capital goods (except transport equipment) | 18,728 | 44.5 | 32,121 | 52.0 | 42,538 | 36.7 | 27,849 | 43.1 | 29,450 | 46.9 |
| 42. Capital goods (except transport equipment), parts and accessories | 5,402 | 12.8 | 7,736 | 12.5 | 24,500 | 21.1 | 8,360 | 12.9 | 8,368 | 13.3 |
| 5. Transport equipment and parts and accessories thereof | 4,047 | 9.6 | 6,762 | 10.9 | 8,656 | 7.5 | 18,379 | 28.4 | 14,025 | 22.3 |
| 51. Passenger motor vehicles | 527 | 1.3 | 669 | 1.1 | 776 | 0.7 | 761 | 1.2 | 676 | 1.1 |
| 52. Transport equipment, other than passenger motor vehicles | 2,996 | 7.1 | 5,656 | 9.2 | 6,965 | 6.0 | 16,995 | 26.3 | 12,305 | 19.6 |
| 521. Transport equipment, other than passenger motor vehicles, industrial | 2,987 | 7.1 | 5,644 | 9.1 | 6,949 | 6.0 | 16,985 | 26.3 | 12,291 | 19.6 |
| 522. Transport equipment, other than passenger motor vehicles, non-industrial | 9 | 0.0 | 12 | 0.0 | 15 | 0.0 | 10 | 0.0 | 14 | 0.0 |
| 53. Transport equipment, parts and accessories | 524 | 1.2 | 437 | 0.7 | 915 | 0.8 | 623 | 1.0 | 1,044 | 1.7 |
| 6. Consumer goods not elsewhere specified | 5,761 | 13.7 | 1,236 | 2.0 | 785 | 0.7 | 1,822 | 2.8 | 290 | 0.5 |
| 61. Consumer goods not elsewhere specified, durable | 86 | 0.2 | 169 | 0.3 | 102 | 0.1 | 125 | 0.2 | 113 | 0.2 |
| 62. Consumer goods not elsewhere specified, semi-durable | 25 | 0.1 | 36 | 0.1 | 142 | 0.1 | 43 | 0.1 | 66 | 0.1 |
| 63. Consumer goods not elsewhere specified, non-durable | 5,650 | 13.4 | 1,031 | 1.7 | 569 | 0.5 | 1,653 | 2.6 | 111 | 0.2 |
| All groups | 42,108 | 100.0 | 61,763 | 100.0 | 115,867 | 100.0 | 64,614 | 100.0 | 62,794 | 100.0 |
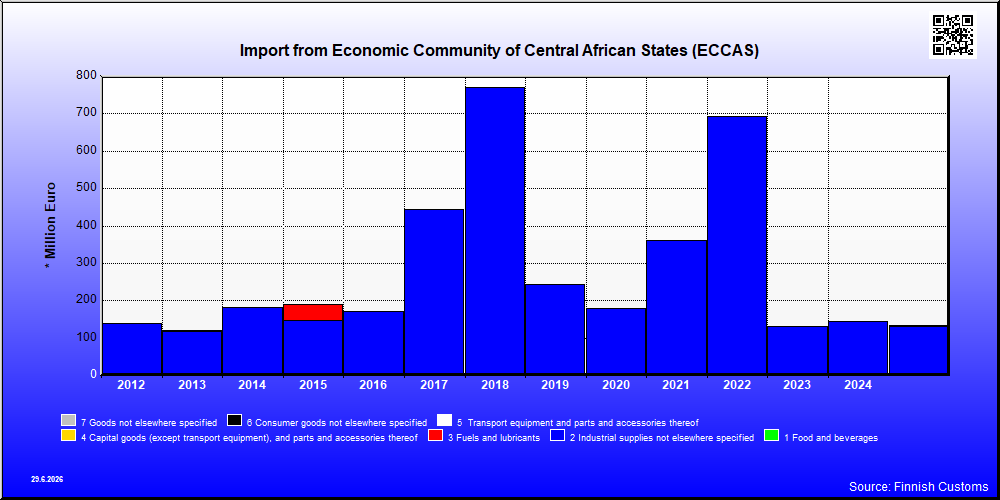
| 2021 | 2022 | 2023 | 2024 | 2025 | ||||||
|---|---|---|---|---|---|---|---|---|---|---|
| 1,000 € | % | 1,000 € | % | 1,000 € | % | 1,000 € | % | 1,000 € | % | |
| 1. Food and beverages | 2,343 | 0.6 | 1,797 | 0.3 | 2,599 | 2.0 | 5,157 | 3.6 | 3,549 | 2.7 |
| 11. Food and beverages, primary | 2,311 | 0.6 | 1,763 | 0.3 | 2,556 | 2.0 | 5,134 | 3.5 | 3,519 | 2.7 |
| 111. Food and beverages, primary, mainly for industry | 2,283 | 0.6 | 1,732 | 0.3 | 2,522 | 1.9 | 5,092 | 3.5 | 3,481 | 2.6 |
| 112. Food and beverages, primary, mainly for household consumption | 28 | 0.0 | 31 | 0.0 | 35 | 0.0 | 42 | 0.0 | 38 | 0.0 |
| 12. Food and beverages, processed | 32 | 0.0 | 34 | 0.0 | 43 | 0.0 | 23 | 0.0 | 30 | 0.0 |
| 121. Food and beverages, processed, mainly for industry | 4 | 0.0 | 4 | 0.0 | 3 | 0.0 | 1 | 0.0 | ||
| 122. Food and beverages, processed, mainly for household consumption | 28 | 0.0 | 30 | 0.0 | 43 | 0.0 | 20 | 0.0 | 29 | 0.0 |
| 2. Industrial supplies not elsewhere specified | 359,361 | 99.2 | 690,010 | 99.7 | 127,755 | 97.5 | 139,299 | 96.3 | 128,710 | 96.9 |
| 21. Industrial supplies not elsewhere specified, primary | 1,460 | 0.2 | 1,151 | 0.9 | 1,563 | 1.1 | 2,285 | 1.7 | ||
| 22. Industrial supplies not elsewhere specified, processed | 359,361 | 99.2 | 688,550 | 99.5 | 126,604 | 96.6 | 137,736 | 95.2 | 126,424 | 95.2 |
| 4. Capital goods (except transport equipment), and parts and accessories thereof | 463 | 0.1 | 71 | 0.0 | 600 | 0.5 | 211 | 0.1 | 406 | 0.3 |
| 41. Capital goods (except transport equipment) | 455 | 0.1 | 44 | 0.0 | 498 | 0.4 | 59 | 0.0 | 69 | 0.1 |
| 42. Capital goods (except transport equipment), parts and accessories | 8 | 0.0 | 27 | 0.0 | 103 | 0.1 | 152 | 0.1 | 381 | 0.3 |
| 5. Transport equipment and parts and accessories thereof | 3 | 0.0 | 2 | 0.0 | 1 | 0.0 | 2 | 0.0 | 1 | 0.0 |
| 51. Passenger motor vehicles | 3 | 0.0 | ||||||||
| 53. Transport equipment, parts and accessories | 2 | 0.0 | 1 | 0.0 | 2 | 0.0 | 1 | 0.0 | ||
| 6. Consumer goods not elsewhere specified | 43 | 0.0 | 4 | 0.0 | 49 | 0.0 | 44 | 0.0 | 114 | 0.1 |
| 61. Consumer goods not elsewhere specified, durable | 4 | 0.0 | 45 | 0.0 | 28 | 0.0 | 9 | 0.0 | ||
| 62. Consumer goods not elsewhere specified, semi-durable | 38 | 0.0 | 3 | 0.0 | 2 | 0.0 | 12 | 0.0 | 104 | 0.1 |
| 63. Consumer goods not elsewhere specified, non-durable | 1 | 0.0 | 1 | 0.0 | 2 | 0.0 | 4 | 0.0 | ||
| 7. Goods not elsewhere specified | 3 | 0.0 | 3 | 0.0 | 4 | 0.0 | 3 | 0.0 | 4 | 0.0 |
| All groups | 362,216 | 100.0 | 691,883 | 100.0 | 130,996 | 100.0 | 144,715 | 100.0 | 132,782 | 100.0 |
| Classification | Description | Year level | Quarter level | Month level | |
|---|---|---|---|---|---|
| SITC | Standard International Trade Classification (classification system is maintained by the United Nations) | ███ | ███ | ███ | |
| BEC | The standard of statistical classification of BEC (Broad Economic Categories) is upheld by the UN and it is based on SITC-nomenclature. | ███ | ███ | ███ | |
| NACE | National industrial classification based on Statistical Classification of Economic Activities in the European Community Nomenclature générale des Activités économiques dans les Communautés européennes | ███ | ███ | ███ | |
| CPA | CPA = Classification of Products by Activities | ███ | ███ | ███ | |
| CN | The Combined Nomenclature is the common nomenclature of the European Community. | ███ | ███ | ███ |