
| Export of goods from Finland and import to Finland | BEC (Broad Economic Categories) |
*) The standard of statistical classification of BEC (Broad Economic Categories) is upheld by the UN and it is based on SITC-nomenclature.

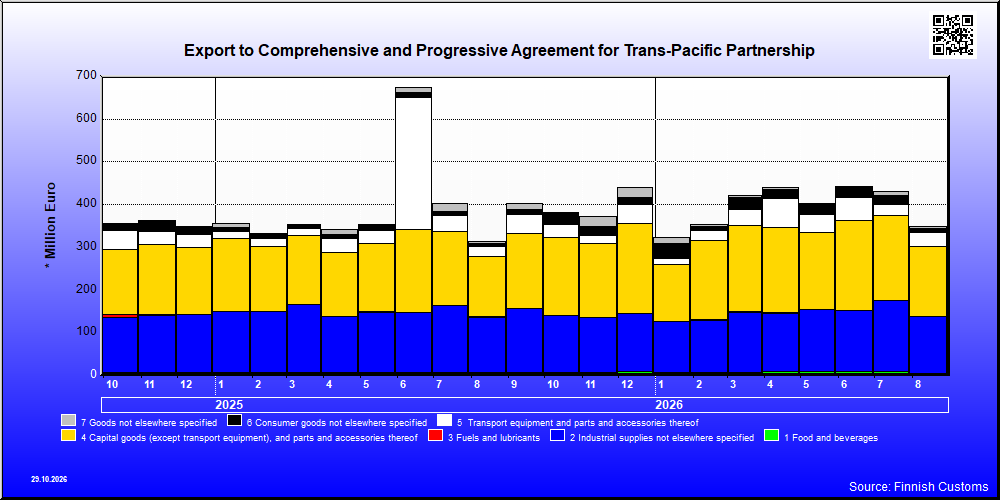
| 8 / 2026 | 8 / 2025 | Change from previous year's equal month % | ||
|---|---|---|---|---|
| 1,000 € | % | 1000 € | ||
| 1. Food and beverages | 5,405 | 1.6 | 6,876 | -21.4 |
| 11. Food and beverages, primary | 209 | 0.1 | 531 | -60.6 |
| 111. Food and beverages, primary, mainly for industry | 5 | 0.0 | 0 | .. |
| 112. Food and beverages, primary, mainly for household consumption | 205 | 0.1 | 531 | -61.5 |
| 12. Food and beverages, processed | 5,196 | 1.5 | 6,345 | -18.1 |
| 121. Food and beverages, processed, mainly for industry | 2,733 | 0.8 | 2,817 | -3.0 |
| 122. Food and beverages, processed, mainly for household consumption | 2,463 | 0.7 | 3,528 | -30.2 |
| 2. Industrial supplies not elsewhere specified | 132,927 | 38.2 | 129,803 | 2.4 |
| 21. Industrial supplies not elsewhere specified, primary | 566 | 0.2 | 6,979 | -91.9 |
| 22. Industrial supplies not elsewhere specified, processed | 132,360 | 38.0 | 122,823 | 7.8 |
| 3. Fuels and lubricants | 456 | 0.1 | 345 | 32.2 |
| 31. Fuels and lubricants, primary | 432 | 0.1 | 313 | 38.1 |
| 32. Fuels and lubricants, processed | 24 | 0.0 | 32 | -25.6 |
| 322. Fuels and lubricants, other | 24 | 0.0 | 32 | -25.6 |
| 4. Capital goods (except transport equipment), and parts and accessories thereof | 163,599 | 47.0 | 142,419 | 14.9 |
| 41. Capital goods (except transport equipment) | 99,100 | 28.5 | 81,090 | 22.2 |
| 42. Capital goods (except transport equipment), parts and accessories | 64,499 | 18.5 | 61,329 | 5.2 |
| 5. Transport equipment and parts and accessories thereof | 32,730 | 9.4 | 22,377 | 46.3 |
| 52. Transport equipment, other than passenger motor vehicles | 23,250 | 6.7 | 9,917 | 134.5 |
| 521. Transport equipment, other than passenger motor vehicles, industrial | 20,835 | 6.0 | 8,809 | 136.5 |
| 522. Transport equipment, other than passenger motor vehicles, non-industrial | 2,415 | 0.7 | 1,108 | 117.9 |
| 53. Transport equipment, parts and accessories | 9,480 | 2.7 | 12,460 | -23.9 |
| 6. Consumer goods not elsewhere specified | 8,205 | 2.4 | 6,990 | 17.4 |
| 61. Consumer goods not elsewhere specified, durable | 2,343 | 0.7 | 1,248 | 87.8 |
| 62. Consumer goods not elsewhere specified, semi-durable | 3,932 | 1.1 | 3,485 | 12.8 |
| 63. Consumer goods not elsewhere specified, non-durable | 1,930 | 0.6 | 2,257 | -14.5 |
| 7. Goods not elsewhere specified | 4,862 | 1.4 | 4,180 | 16.3 |
| All groups | 348,184 | 100.0 | 312,990 | 11.2 |

| 8 / 2026 | 8 / 2025 | Change from previous year's equal month % | ||
|---|---|---|---|---|
| 1,000 € | % | 1,000 € | ||
| 1. Food and beverages | 14,456 | 1.9 | 9,455 | 52.9 |
| 11. Food and beverages, primary | 6,941 | 0.9 | 3,823 | 81.5 |
| 111. Food and beverages, primary, mainly for industry | 1,534 | 0.2 | 162 | 845.3 |
| 112. Food and beverages, primary, mainly for household consumption | 5,407 | 0.7 | 3,661 | 47.7 |
| 12. Food and beverages, processed | 7,515 | 1.0 | 5,631 | 33.5 |
| 121. Food and beverages, processed, mainly for industry | 325 | 0.0 | 168 | 94.0 |
| 122. Food and beverages, processed, mainly for household consumption | 7,190 | 0.9 | 5,464 | 31.6 |
| 2. Industrial supplies not elsewhere specified | 322,237 | 41.5 | 86,133 | 274.1 |
| 21. Industrial supplies not elsewhere specified, primary | 261,949 | 33.7 | 47,634 | 449.9 |
| 22. Industrial supplies not elsewhere specified, processed | 60,287 | 7.8 | 38,498 | 56.6 |
| 3. Fuels and lubricants | 19,452 | 2.5 | 14,240 | 36.6 |
| 31. Fuels and lubricants, primary | 18,945 | 2.4 | 6,595 | 187.3 |
| 32. Fuels and lubricants, processed | 508 | 0.1 | 7,646 | -93.4 |
| 322. Fuels and lubricants, other | 508 | 0.1 | 7,646 | -93.4 |
| 4. Capital goods (except transport equipment), and parts and accessories thereof | 326,967 | 42.1 | 187,924 | 74.0 |
| 41. Capital goods (except transport equipment) | 293,821 | 37.8 | 161,928 | 81.5 |
| 42. Capital goods (except transport equipment), parts and accessories | 33,146 | 4.3 | 25,996 | 27.5 |
| 5. Transport equipment and parts and accessories thereof | 48,053 | 6.2 | 39,771 | 20.8 |
| 51. Passenger motor vehicles | 28,598 | 3.7 | 15,826 | 80.7 |
| 52. Transport equipment, other than passenger motor vehicles | 4,739 | 0.6 | 4,497 | 5.4 |
| 521. Transport equipment, other than passenger motor vehicles, industrial | 3,163 | 0.4 | 3,451 | -8.3 |
| 522. Transport equipment, other than passenger motor vehicles, non-industrial | 1,576 | 0.2 | 1,046 | 50.6 |
| 53. Transport equipment, parts and accessories | 14,716 | 1.9 | 19,448 | -24.3 |
| 6. Consumer goods not elsewhere specified | 43,926 | 5.7 | 26,445 | 66.1 |
| 61. Consumer goods not elsewhere specified, durable | 6,496 | 0.8 | 3,757 | 72.9 |
| 62. Consumer goods not elsewhere specified, semi-durable | 26,154 | 3.4 | 16,899 | 54.8 |
| 63. Consumer goods not elsewhere specified, non-durable | 11,276 | 1.5 | 5,790 | 94.8 |
| 7. Goods not elsewhere specified | 1,821 | 0.2 | 2,113 | -13.8 |
| All groups | 776,911 | 100.0 | 366,081 | 112.2 |
| Classification | Description | Year level | Quarter level | Month level | Year 2026 sofar |
|---|---|---|---|---|---|
| SITC | Standard International Trade Classification (classification system is maintained by the United Nations) | ███ | ███ | ███ | ███ |
| BEC | The standard of statistical classification of BEC (Broad Economic Categories) is upheld by the UN and it is based on SITC-nomenclature. | ███ | ███ | ███ | ███ |
| NACE | National industrial classification based on Statistical Classification of Economic Activities in the European Community Nomenclature générale des Activités économiques dans les Communautés européennes | ███ | ███ | ███ | ███ |
| CPA | CPA = Classification of Products by Activities | ███ | ███ | ███ | ███ |
| CN | The Combined Nomenclature is the common nomenclature of the European Community. | ███ | ███ | ███ | ███ |