
| Export of goods from Finland and import to Finland | BEC (Broad Economic Categories) |
*) The standard of statistical classification of BEC (Broad Economic Categories) is upheld by the UN and it is based on SITC-nomenclature.
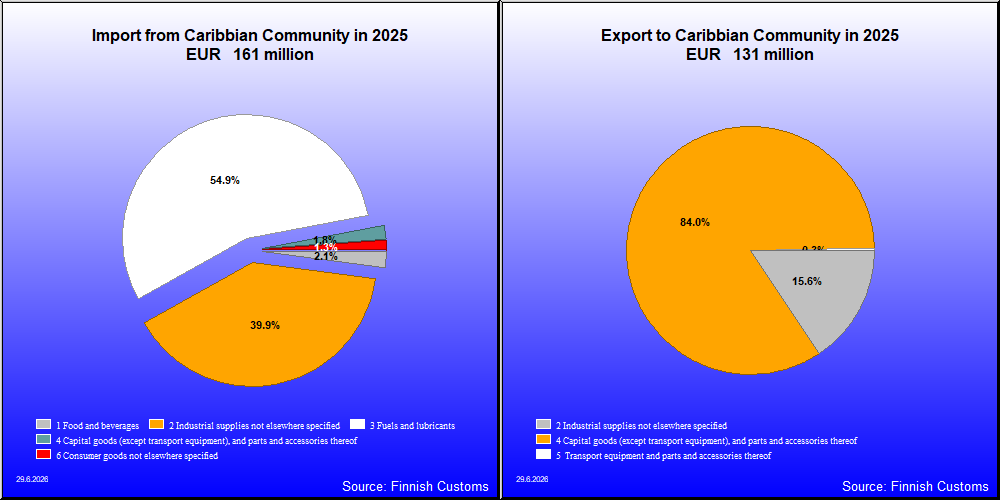

| 2021 | 2022 | 2023 | 2024 | 2025 | ||||||
|---|---|---|---|---|---|---|---|---|---|---|
| 1,000 € | % | 1,000 € | % | 1,000 € | % | 1,000 € | % | 1,000 € | % | |
| 1. Food and beverages | 243 | 0.4 | 170 | 0.3 | 242 | 0.3 | 214 | 0.2 | 277 | 0.2 |
| 12. Food and beverages, processed | 243 | 0.4 | 170 | 0.3 | 242 | 0.3 | 214 | 0.2 | 277 | 0.2 |
| 122. Food and beverages, processed, mainly for household consumption | 243 | 0.4 | 170 | 0.3 | 241 | 0.3 | 214 | 0.2 | 277 | 0.2 |
| 2. Industrial supplies not elsewhere specified | 12,551 | 18.3 | 9,861 | 19.1 | 10,034 | 13.7 | 15,519 | 11.2 | 20,411 | 15.6 |
| 21. Industrial supplies not elsewhere specified, primary | 34 | 0.0 | 74 | 0.1 | 63 | 0.1 | 77 | 0.1 | 95 | 0.1 |
| 22. Industrial supplies not elsewhere specified, processed | 12,517 | 18.2 | 9,787 | 18.9 | 9,971 | 13.6 | 15,443 | 11.1 | 20,317 | 15.5 |
| 3. Fuels and lubricants | 24,922 | 36.2 | 37 | 0.1 | 29,872 | 40.6 | 55,925 | 40.3 | 64 | 0.0 |
| 31. Fuels and lubricants, primary | 50 | 0.1 | 29 | 0.1 | 44 | 0.1 | 20 | 0.0 | 20 | 0.0 |
| 32. Fuels and lubricants, processed | 24,872 | 36.2 | 8 | 0.0 | 29,828 | 40.6 | 55,906 | 40.3 | 44 | 0.0 |
| 321. Fuels and lubricants, motor spirit | 24,871 | 36.2 | 29,804 | 40.5 | 55,904 | 40.3 | ||||
| 322. Fuels and lubricants, other | 1 | 0.0 | 8 | 0.0 | 24 | 0.0 | 1 | 0.0 | 44 | 0.0 |
| 4. Capital goods (except transport equipment), and parts and accessories thereof | 24,390 | 35.5 | 39,693 | 76.8 | 32,989 | 44.9 | 60,960 | 44.0 | 109,563 | 83.6 |
| 41. Capital goods (except transport equipment) | 15,152 | 22.0 | 26,212 | 50.7 | 18,379 | 25.0 | 32,684 | 23.6 | 98,100 | 74.9 |
| 42. Capital goods (except transport equipment), parts and accessories | 9,237 | 13.4 | 13,481 | 26.1 | 14,610 | 19.9 | 28,429 | 20.5 | 11,526 | 8.8 |
| 5. Transport equipment and parts and accessories thereof | 2,381 | 3.5 | 337 | 0.7 | 73 | 0.1 | 4,757 | 3.4 | 452 | 0.3 |
| 51. Passenger motor vehicles | 17 | 0.0 | ||||||||
| 52. Transport equipment, other than passenger motor vehicles | 1,925 | 2.8 | 293 | 0.6 | 9 | 0.0 | 4,639 | 3.3 | ||
| 521. Transport equipment, other than passenger motor vehicles, industrial | 293 | 0.6 | 9 | 0.0 | 4,639 | 3.3 | ||||
| 522. Transport equipment, other than passenger motor vehicles, non-industrial | 1,925 | 2.8 | ||||||||
| 53. Transport equipment, parts and accessories | 457 | 0.7 | 44 | 0.1 | 64 | 0.1 | 100 | 0.1 | 452 | 0.3 |
| 6. Consumer goods not elsewhere specified | 988 | 1.4 | 400 | 0.8 | 314 | 0.4 | 145 | 0.1 | 246 | 0.2 |
| 61. Consumer goods not elsewhere specified, durable | 866 | 1.3 | 159 | 0.3 | 37 | 0.1 | 36 | 0.0 | 27 | 0.0 |
| 62. Consumer goods not elsewhere specified, semi-durable | 99 | 0.1 | 214 | 0.4 | 245 | 0.3 | 99 | 0.1 | 132 | 0.1 |
| 63. Consumer goods not elsewhere specified, non-durable | 70 | 0.1 | 27 | 0.1 | 32 | 0.0 | 11 | 0.0 | 87 | 0.1 |
| 7. Goods not elsewhere specified | 3,286 | 4.8 | 1,218 | 2.4 | 1,097 | 0.8 | ||||
| All groups | 68,761 | 100.0 | 51,661 | 100.0 | 73,503 | 100.0 | 138,618 | 100.0 | 130,985 | 100.0 |

| 2021 | 2022 | 2023 | 2024 | 2025 | ||||||
|---|---|---|---|---|---|---|---|---|---|---|
| 1,000 € | % | 1,000 € | % | 1,000 € | % | 1,000 € | % | 1,000 € | % | |
| 1. Food and beverages | 3,382 | 4.8 | 3,804 | 7.0 | 3,481 | 1.7 | 3,900 | 1.7 | 3,323 | 2.1 |
| 11. Food and beverages, primary | 380 | 0.5 | 169 | 0.3 | 148 | 0.1 | 188 | 0.1 | 309 | 0.2 |
| 111. Food and beverages, primary, mainly for industry | 15 | 0.0 | 35 | 0.1 | 28 | 0.0 | 3 | 0.0 | 18 | 0.0 |
| 112. Food and beverages, primary, mainly for household consumption | 365 | 0.5 | 134 | 0.2 | 120 | 0.1 | 185 | 0.1 | 291 | 0.2 |
| 12. Food and beverages, processed | 3,001 | 4.3 | 3,635 | 6.7 | 3,332 | 1.6 | 3,712 | 1.7 | 3,013 | 1.9 |
| 121. Food and beverages, processed, mainly for industry | 21 | 0.0 | 25 | 0.0 | 43 | 0.0 | 108 | 0.0 | 21 | 0.0 |
| 122. Food and beverages, processed, mainly for household consumption | 2,981 | 4.3 | 3,610 | 6.6 | 3,289 | 1.6 | 3,604 | 1.6 | 2,992 | 1.9 |
| 2. Industrial supplies not elsewhere specified | 62,600 | 89.4 | 45,713 | 83.8 | 146,286 | 72.3 | 69,093 | 30.9 | 64,320 | 39.9 |
| 21. Industrial supplies not elsewhere specified, primary | 5 | 0.0 | 21 | 0.0 | 38 | 0.0 | 14 | 0.0 | ||
| 22. Industrial supplies not elsewhere specified, processed | 62,600 | 89.4 | 45,707 | 83.8 | 146,265 | 72.3 | 69,055 | 30.9 | 64,306 | 39.9 |
| 3. Fuels and lubricants | 47,544 | 23.5 | 145,122 | 65.0 | 88,473 | 54.9 | ||||
| 31. Fuels and lubricants, primary | 47,543 | 23.5 | 145,122 | 65.0 | 88,473 | 54.9 | ||||
| 4. Capital goods (except transport equipment), and parts and accessories thereof | 2,168 | 3.1 | 2,840 | 5.2 | 2,719 | 1.3 | 3,240 | 1.5 | 2,919 | 1.8 |
| 41. Capital goods (except transport equipment) | 1,788 | 2.6 | 2,273 | 4.2 | 2,320 | 1.1 | 2,836 | 1.3 | 2,606 | 1.6 |
| 42. Capital goods (except transport equipment), parts and accessories | 379 | 0.5 | 568 | 1.0 | 399 | 0.2 | 404 | 0.2 | 314 | 0.2 |
| 5. Transport equipment and parts and accessories thereof | 17 | 0.0 | 20 | 0.0 | 11 | 0.0 | 22 | 0.0 | 11 | 0.0 |
| 51. Passenger motor vehicles | 2 | 0.0 | ||||||||
| 53. Transport equipment, parts and accessories | 17 | 0.0 | 20 | 0.0 | 11 | 0.0 | 22 | 0.0 | 9 | 0.0 |
| 6. Consumer goods not elsewhere specified | 1,794 | 2.6 | 2,118 | 3.9 | 2,318 | 1.1 | 1,918 | 0.9 | 2,140 | 1.3 |
| 61. Consumer goods not elsewhere specified, durable | 6 | 0.0 | 41 | 0.1 | 64 | 0.0 | 10 | 0.0 | 2 | 0.0 |
| 62. Consumer goods not elsewhere specified, semi-durable | 1,561 | 2.2 | 1,895 | 3.5 | 2,083 | 1.0 | 1,705 | 0.8 | 2,024 | 1.3 |
| 63. Consumer goods not elsewhere specified, non-durable | 227 | 0.3 | 181 | 0.3 | 170 | 0.1 | 202 | 0.1 | 113 | 0.1 |
| 7. Goods not elsewhere specified | 201 | 0.3 | 47 | 0.1 | 4 | 0.0 | 60 | 0.0 | 3 | 0.0 |
| All groups | 70,030 | 100.0 | 54,538 | 100.0 | 202,361 | 100.0 | 223,352 | 100.0 | 161,189 | 100.0 |
| Classification | Description | Year level | Quarter level | Month level | |
|---|---|---|---|---|---|
| SITC | Standard International Trade Classification (classification system is maintained by the United Nations) | ███ | ███ | ███ | |
| BEC | The standard of statistical classification of BEC (Broad Economic Categories) is upheld by the UN and it is based on SITC-nomenclature. | ███ | ███ | ███ | |
| NACE | National industrial classification based on Statistical Classification of Economic Activities in the European Community Nomenclature générale des Activités économiques dans les Communautés européennes | ███ | ███ | ███ | |
| CPA | CPA = Classification of Products by Activities | ███ | ███ | ███ | |
| CN | The Combined Nomenclature is the common nomenclature of the European Community. | ███ | ███ | ███ |