
| Export of goods from Finland and import to Finland | BEC (Broad Economic Categories) |
*) The standard of statistical classification of BEC (Broad Economic Categories) is upheld by the UN and it is based on SITC-nomenclature.
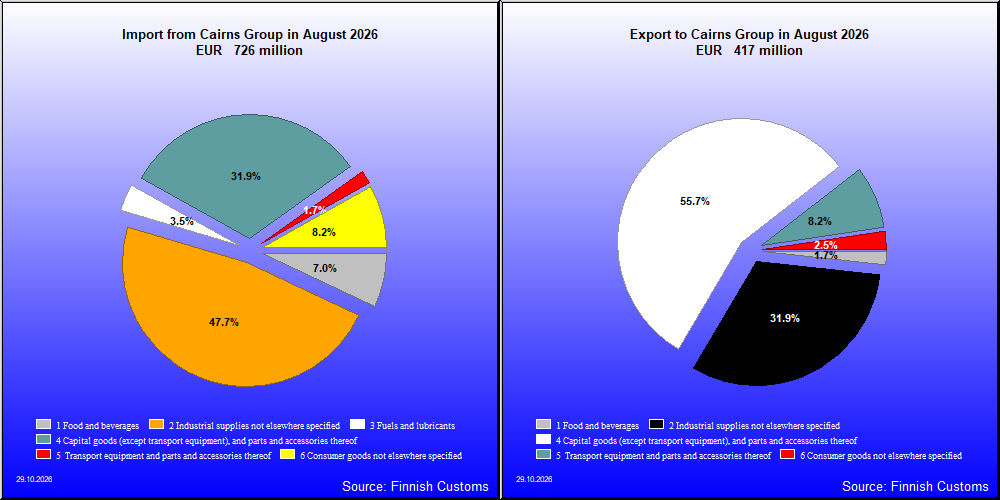

| 8 / 2026 | 8 / 2025 | Change from previous year's equal month % | ||
|---|---|---|---|---|
| 1,000 € | % | 1000 € | ||
| 1. Food and beverages | 7,161 | 1.7 | 6,597 | 8.5 |
| 11. Food and beverages, primary | 244 | 0.1 | 468 | -47.8 |
| 111. Food and beverages, primary, mainly for industry | 2 | 0.0 | 0 | 483.2 |
| 112. Food and beverages, primary, mainly for household consumption | 242 | 0.1 | 467 | -48.2 |
| 12. Food and beverages, processed | 6,916 | 1.7 | 6,129 | 12.8 |
| 121. Food and beverages, processed, mainly for industry | 4,450 | 1.1 | 3,514 | 26.6 |
| 122. Food and beverages, processed, mainly for household consumption | 2,466 | 0.6 | 2,615 | -5.7 |
| 2. Industrial supplies not elsewhere specified | 132,932 | 31.9 | 130,263 | 2.0 |
| 21. Industrial supplies not elsewhere specified, primary | 11,959 | 2.9 | 9,055 | 32.1 |
| 22. Industrial supplies not elsewhere specified, processed | 120,973 | 29.0 | 121,208 | -0.2 |
| 3. Fuels and lubricants | 189 | 0.0 | 48 | 294.3 |
| 31. Fuels and lubricants, primary | 172 | 0.0 | 13 | .. |
| 32. Fuels and lubricants, processed | 16 | 0.0 | 35 | -53.7 |
| 322. Fuels and lubricants, other | 16 | 0.0 | 35 | -53.7 |
| 4. Capital goods (except transport equipment), and parts and accessories thereof | 232,199 | 55.7 | 171,315 | 35.5 |
| 41. Capital goods (except transport equipment) | 155,371 | 37.2 | 104,927 | 48.1 |
| 42. Capital goods (except transport equipment), parts and accessories | 76,829 | 18.4 | 66,388 | 15.7 |
| 5. Transport equipment and parts and accessories thereof | 34,047 | 8.2 | 23,408 | 45.5 |
| 51. Passenger motor vehicles | 0 | 0 | 337 | .. |
| 52. Transport equipment, other than passenger motor vehicles | 24,586 | 5.9 | 10,800 | 127.6 |
| 521. Transport equipment, other than passenger motor vehicles, industrial | 24,033 | 5.8 | 10,643 | 125.8 |
| 522. Transport equipment, other than passenger motor vehicles, non-industrial | 553 | 0.1 | 158 | 250.7 |
| 53. Transport equipment, parts and accessories | 9,462 | 2.3 | 12,271 | -22.9 |
| 6. Consumer goods not elsewhere specified | 10,284 | 2.5 | 6,603 | 55.8 |
| 61. Consumer goods not elsewhere specified, durable | 2,728 | 0.7 | 1,899 | 43.7 |
| 62. Consumer goods not elsewhere specified, semi-durable | 3,268 | 0.8 | 2,095 | 56.0 |
| 63. Consumer goods not elsewhere specified, non-durable | 4,287 | 1.0 | 2,609 | 64.3 |
| 7. Goods not elsewhere specified | 417 | 0.1 | 554 | -24.7 |
| All groups | 417,228 | 100.0 | 338,787 | 23.2 |
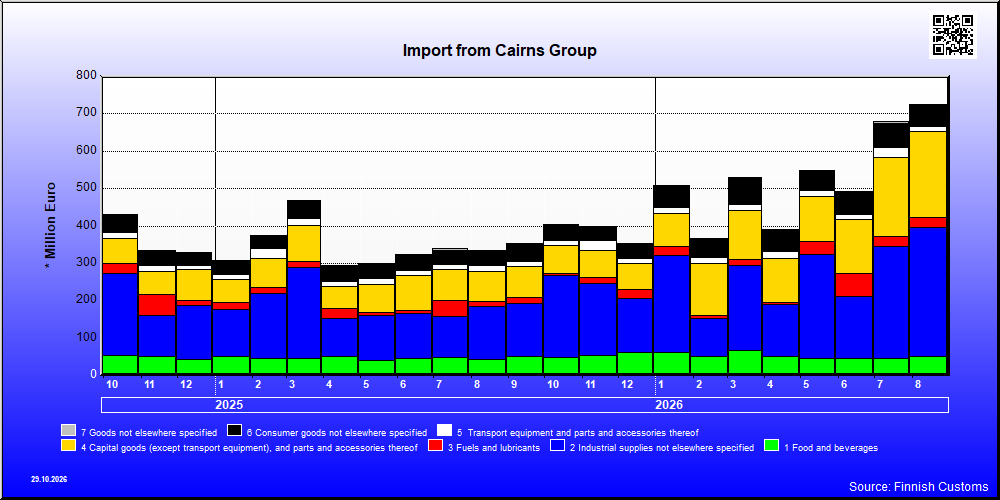
| 8 / 2026 | 8 / 2025 | Change from previous year's equal month % | ||
|---|---|---|---|---|
| 1,000 € | % | 1,000 € | ||
| 1. Food and beverages | 50,424 | 6.9 | 42,001 | 20.1 |
| 11. Food and beverages, primary | 32,796 | 4.5 | 27,240 | 20.4 |
| 111. Food and beverages, primary, mainly for industry | 18,414 | 2.5 | 13,750 | 33.9 |
| 112. Food and beverages, primary, mainly for household consumption | 14,382 | 2.0 | 13,490 | 6.6 |
| 12. Food and beverages, processed | 17,628 | 2.4 | 14,760 | 19.4 |
| 121. Food and beverages, processed, mainly for industry | 480 | 0.1 | 289 | 66.1 |
| 122. Food and beverages, processed, mainly for household consumption | 17,148 | 2.4 | 14,471 | 18.5 |
| 2. Industrial supplies not elsewhere specified | 345,746 | 47.6 | 143,444 | 141.0 |
| 21. Industrial supplies not elsewhere specified, primary | 273,254 | 37.6 | 94,717 | 188.5 |
| 22. Industrial supplies not elsewhere specified, processed | 72,492 | 10.0 | 48,727 | 48.8 |
| 3. Fuels and lubricants | 25,321 | 3.5 | 12,250 | 106.7 |
| 31. Fuels and lubricants, primary | 18,945 | 2.6 | 6,595 | 187.3 |
| 32. Fuels and lubricants, processed | 6,376 | 0.9 | 5,656 | 12.7 |
| 322. Fuels and lubricants, other | 6,376 | 0.9 | 5,656 | 12.7 |
| 4. Capital goods (except transport equipment), and parts and accessories thereof | 231,063 | 31.8 | 81,399 | 183.9 |
| 41. Capital goods (except transport equipment) | 172,532 | 23.8 | 63,093 | 173.5 |
| 42. Capital goods (except transport equipment), parts and accessories | 58,531 | 8.1 | 18,306 | 219.7 |
| 5. Transport equipment and parts and accessories thereof | 12,666 | 1.7 | 14,929 | -15.2 |
| 51. Passenger motor vehicles | 464 | 0.1 | 282 | 64.6 |
| 52. Transport equipment, other than passenger motor vehicles | 651 | 0.1 | 2,607 | -75.0 |
| 521. Transport equipment, other than passenger motor vehicles, industrial | 426 | 0.1 | 1,773 | -75.9 |
| 522. Transport equipment, other than passenger motor vehicles, non-industrial | 225 | 0.0 | 834 | -73.0 |
| 53. Transport equipment, parts and accessories | 11,550 | 1.6 | 12,040 | -4.1 |
| 6. Consumer goods not elsewhere specified | 59,375 | 8.2 | 38,461 | 54.4 |
| 61. Consumer goods not elsewhere specified, durable | 8,494 | 1.2 | 5,366 | 58.3 |
| 62. Consumer goods not elsewhere specified, semi-durable | 39,198 | 5.4 | 27,123 | 44.5 |
| 63. Consumer goods not elsewhere specified, non-durable | 11,682 | 1.6 | 5,972 | 95.6 |
| 7. Goods not elsewhere specified | 1,600 | 0.2 | 1,811 | -11.6 |
| All groups | 726,194 | 100.0 | 334,295 | 117.2 |
| Classification | Description | Year level | Quarter level | Month level | Year 2026 sofar |
|---|---|---|---|---|---|
| SITC | Standard International Trade Classification (classification system is maintained by the United Nations) | ███ | ███ | ███ | ███ |
| BEC | The standard of statistical classification of BEC (Broad Economic Categories) is upheld by the UN and it is based on SITC-nomenclature. | ███ | ███ | ███ | ███ |
| NACE | National industrial classification based on Statistical Classification of Economic Activities in the European Community Nomenclature générale des Activités économiques dans les Communautés européennes | ███ | ███ | ███ | ███ |
| CPA | CPA = Classification of Products by Activities | ███ | ███ | ███ | ███ |
| CN | The Combined Nomenclature is the common nomenclature of the European Community. | ███ | ███ | ███ | ███ |