
| Export of goods from Finland and import to Finland | BEC (Broad Economic Categories) |
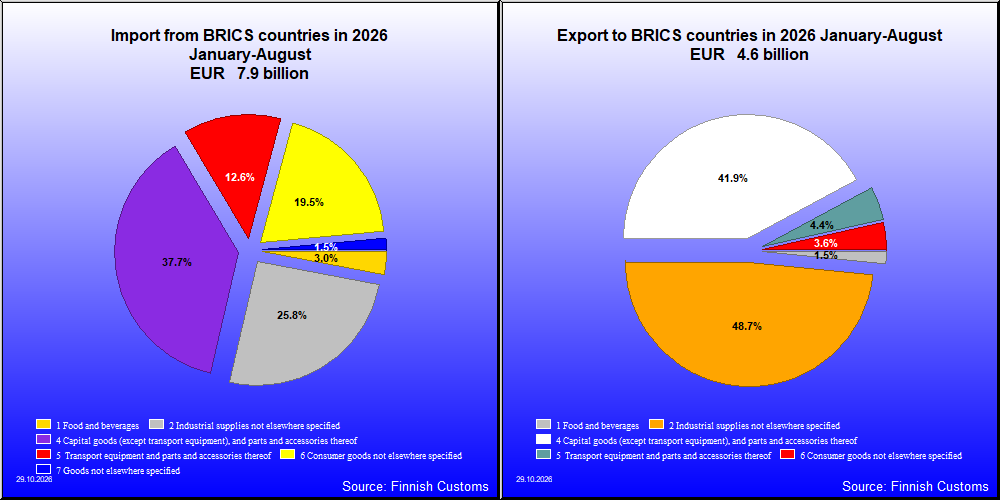
| 2026 1-8 1,000 € | 2025 1-8 1,000 € | Change % |
|
|---|---|---|---|
| 1. Food and beverages | 70,672 | 74,687 | -5.4 |
| 11. Food and beverages, primary | 1,513 | 1,902 | -20.5 |
| 111. Food and beverages, primary, mainly for industry | 40 | 2 | .. |
| 112. Food and beverages, primary, mainly for household consumption | 1,473 | 1,900 | -22.5 |
| 12. Food and beverages, processed | 69,159 | 72,785 | -5.0 |
| 121. Food and beverages, processed, mainly for industry | 40,066 | 40,380 | -0.8 |
| 122. Food and beverages, processed, mainly for household consumption | 29,093 | 32,405 | -10.2 |
| 2. Industrial supplies not elsewhere specified | 2,257,554 | 2,100,520 | 7.5 |
| 21. Industrial supplies not elsewhere specified, primary | 231,389 | 129,206 | 79.1 |
| 22. Industrial supplies not elsewhere specified, processed | 2,026,165 | 1,971,315 | 2.8 |
| 3. Fuels and lubricants | 2,405 | 1,864 | 29.0 |
| 31. Fuels and lubricants, primary | 2,155 | 1,467 | 46.9 |
| 32. Fuels and lubricants, processed | 250 | 397 | -37.1 |
| 321. Fuels and lubricants, motor spirit | 0 | 220 | .. |
| 322. Fuels and lubricants, other | 250 | 177 | 41.1 |
| 4. Capital goods (except transport equipment), and parts and accessories thereof | 1,942,215 | 1,593,497 | 21.9 |
| 41. Capital goods (except transport equipment) | 1,193,132 | 1,013,173 | 17.8 |
| 42. Capital goods (except transport equipment), parts and accessories | 749,084 | 580,332 | 29.1 |
| 5. Transport equipment and parts and accessories thereof | 202,335 | 194,801 | 3.9 |
| 51. Passenger motor vehicles | 385 | 542 | -28.9 |
| 52. Transport equipment, other than passenger motor vehicles | 49,398 | 78,467 | -37.0 |
| 521. Transport equipment, other than passenger motor vehicles, industrial | 48,387 | 76,017 | -36.3 |
| 522. Transport equipment, other than passenger motor vehicles, non-industrial | 1,011 | 2,450 | -58.7 |
| 53. Transport equipment, parts and accessories | 152,551 | 115,793 | 31.7 |
| 6. Consumer goods not elsewhere specified | 167,571 | 85,751 | 95.4 |
| 61. Consumer goods not elsewhere specified, durable | 10,447 | 14,982 | -30.3 |
| 62. Consumer goods not elsewhere specified, semi-durable | 32,761 | 31,573 | 3.8 |
| 63. Consumer goods not elsewhere specified, non-durable | 124,363 | 39,196 | 217.3 |
| 7. Goods not elsewhere specified | 4,849 | 22,497 | -78.4 |
| All groups | 4,647,601 | 4,073,617 | 14.1 |
| 2026 1-8 1,000 € | 2025 1-8 1,000 € | Change % |
|
|---|---|---|---|
| 1. Food and beverages | 236,941 | 208,764 | 13.5 |
| 11. Food and beverages, primary | 176,604 | 156,256 | 13.0 |
| 111. Food and beverages, primary, mainly for industry | 113,847 | 87,685 | 29.8 |
| 112. Food and beverages, primary, mainly for household consumption | 62,756 | 68,572 | -8.5 |
| 12. Food and beverages, processed | 60,337 | 52,507 | 14.9 |
| 121. Food and beverages, processed, mainly for industry | 2,314 | 1,467 | 57.7 |
| 122. Food and beverages, processed, mainly for household consumption | 58,023 | 51,041 | 13.7 |
| 2. Industrial supplies not elsewhere specified | 2,034,122 | 1,653,655 | 23.0 |
| 21. Industrial supplies not elsewhere specified, primary | 256,336 | 251,857 | 1.8 |
| 22. Industrial supplies not elsewhere specified, processed | 1,777,786 | 1,401,798 | 26.8 |
| 3. Fuels and lubricants | 1,527 | 5,873 | -74.0 |
| 31. Fuels and lubricants, primary | 140 | 0 | .. |
| 32. Fuels and lubricants, processed | 1,387 | 5,873 | -76.4 |
| 321. Fuels and lubricants, motor spirit | 0 | 0 | .. |
| 322. Fuels and lubricants, other | 1,387 | 5,873 | -76.4 |
| 4. Capital goods (except transport equipment), and parts and accessories thereof | 2,975,708 | 2,160,374 | 37.7 |
| 41. Capital goods (except transport equipment) | 2,121,529 | 1,604,188 | 32.2 |
| 42. Capital goods (except transport equipment), parts and accessories | 854,179 | 556,186 | 53.6 |
| 5. Transport equipment and parts and accessories thereof | 994,801 | 825,062 | 20.6 |
| 51. Passenger motor vehicles | 170,099 | 124,698 | 36.4 |
| 52. Transport equipment, other than passenger motor vehicles | 127,865 | 109,175 | 17.1 |
| 521. Transport equipment, other than passenger motor vehicles, industrial | 96,657 | 73,141 | 32.2 |
| 522. Transport equipment, other than passenger motor vehicles, non-industrial | 31,208 | 36,034 | -13.4 |
| 53. Transport equipment, parts and accessories | 696,837 | 591,189 | 17.9 |
| 6. Consumer goods not elsewhere specified | 1,535,788 | 1,183,667 | 29.7 |
| 61. Consumer goods not elsewhere specified, durable | 386,207 | 289,640 | 33.3 |
| 62. Consumer goods not elsewhere specified, semi-durable | 894,166 | 682,641 | 31.0 |
| 63. Consumer goods not elsewhere specified, non-durable | 255,415 | 211,386 | 20.8 |
| 7. Goods not elsewhere specified | 116,694 | 150,026 | -22.2 |
| All groups | 7,895,581 | 6,187,421 | 27.6 |
| Classification | Description | Year level | Quarter level | Month level | Year 2026 sofar |
|---|---|---|---|---|---|
| SITC | Standard International Trade Classification (classification system is maintained by the United Nations) | ███ | ███ | ███ | ███ |
| BEC | The standard of statistical classification of BEC (Broad Economic Categories) is upheld by the UN and it is based on SITC-nomenclature. | ███ | ███ | ███ | ███ |
| NACE | National industrial classification based on Statistical Classification of Economic Activities in the European Community Nomenclature générale des Activités économiques dans les Communautés européennes | ███ | ███ | ███ | ███ |
| CPA | CPA = Classification of Products by Activities | ███ | ███ | ███ | ███ |
| CN | The Combined Nomenclature is the common nomenclature of the European Community. | ███ | ███ | ███ | ███ |