
| Export of goods from Finland and import to Finland | BEC (Broad Economic Categories) |
*) The standard of statistical classification of BEC (Broad Economic Categories) is upheld by the UN and it is based on SITC-nomenclature.
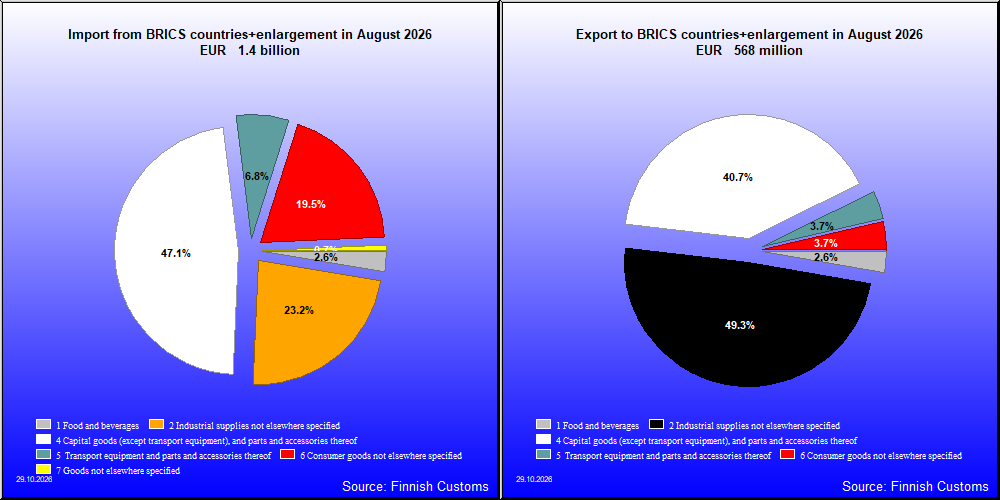
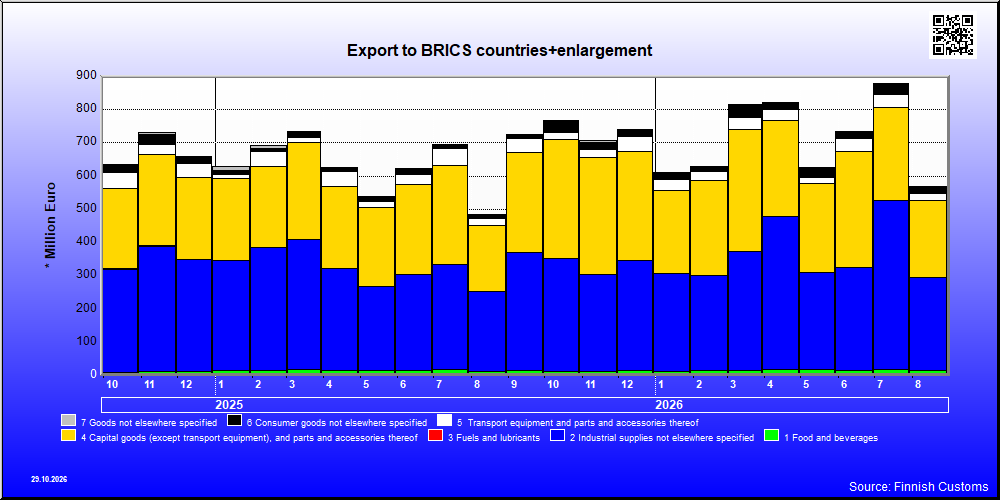
| 8 / 2026 | 8 / 2025 | Change from previous year's equal month % | ||
|---|---|---|---|---|
| 1,000 € | % | 1000 € | ||
| 1. Food and beverages | 14,911 | 2.6 | 13,289 | 12.2 |
| 11. Food and beverages, primary | 233 | 0.0 | 575 | -59.6 |
| 111. Food and beverages, primary, mainly for industry | 0 | 0 | 0 | .. |
| 112. Food and beverages, primary, mainly for household consumption | 233 | 0.0 | 575 | -59.6 |
| 12. Food and beverages, processed | 14,678 | 2.6 | 12,714 | 15.5 |
| 121. Food and beverages, processed, mainly for industry | 10,074 | 1.8 | 6,875 | 46.5 |
| 122. Food and beverages, processed, mainly for household consumption | 4,604 | 0.8 | 5,839 | -21.1 |
| 2. Industrial supplies not elsewhere specified | 280,208 | 49.3 | 239,619 | 16.9 |
| 21. Industrial supplies not elsewhere specified, primary | 47,567 | 8.4 | 15,237 | 212.2 |
| 22. Industrial supplies not elsewhere specified, processed | 232,641 | 40.9 | 224,382 | 3.7 |
| 3. Fuels and lubricants | 53 | 0.0 | 136 | -60.9 |
| 31. Fuels and lubricants, primary | 26 | 0.0 | 125 | -79.3 |
| 32. Fuels and lubricants, processed | 28 | 0.0 | 11 | 139.8 |
| 322. Fuels and lubricants, other | 28 | 0.0 | 11 | 139.8 |
| 4. Capital goods (except transport equipment), and parts and accessories thereof | 230,825 | 40.6 | 198,981 | 16.0 |
| 41. Capital goods (except transport equipment) | 127,447 | 22.4 | 110,935 | 14.9 |
| 42. Capital goods (except transport equipment), parts and accessories | 103,378 | 18.2 | 88,046 | 17.4 |
| 5. Transport equipment and parts and accessories thereof | 21,052 | 3.7 | 20,381 | 3.3 |
| 51. Passenger motor vehicles | 22 | 0.0 | 0 | .. |
| 52. Transport equipment, other than passenger motor vehicles | 7,656 | 1.3 | 5,676 | 34.9 |
| 521. Transport equipment, other than passenger motor vehicles, industrial | 6,479 | 1.1 | 4,084 | 58.6 |
| 522. Transport equipment, other than passenger motor vehicles, non-industrial | 1,178 | 0.2 | 1,592 | -26.0 |
| 53. Transport equipment, parts and accessories | 13,374 | 2.4 | 14,705 | -9.0 |
| 6. Consumer goods not elsewhere specified | 20,827 | 3.7 | 11,533 | 80.6 |
| 61. Consumer goods not elsewhere specified, durable | 1,962 | 0.3 | 3,093 | -36.6 |
| 62. Consumer goods not elsewhere specified, semi-durable | 6,581 | 1.2 | 3,919 | 67.9 |
| 63. Consumer goods not elsewhere specified, non-durable | 12,284 | 2.2 | 4,521 | 171.7 |
| 7. Goods not elsewhere specified | 299 | 0.1 | 1,673 | -82.1 |
| All groups | 568,175 | 100.0 | 485,613 | 17.0 |

| 8 / 2026 | 8 / 2025 | Change from previous year's equal month % | ||
|---|---|---|---|---|
| 1,000 € | % | 1,000 € | ||
| 1. Food and beverages | 35,876 | 2.6 | 31,419 | 14.2 |
| 11. Food and beverages, primary | 21,271 | 1.5 | 19,101 | 11.4 |
| 111. Food and beverages, primary, mainly for industry | 13,299 | 1.0 | 10,159 | 30.9 |
| 112. Food and beverages, primary, mainly for household consumption | 7,972 | 0.6 | 8,941 | -10.8 |
| 12. Food and beverages, processed | 14,605 | 1.1 | 12,318 | 18.6 |
| 121. Food and beverages, processed, mainly for industry | 332 | 0.0 | 85 | 288.1 |
| 122. Food and beverages, processed, mainly for household consumption | 14,273 | 1.0 | 12,233 | 16.7 |
| 2. Industrial supplies not elsewhere specified | 318,161 | 23.2 | 243,123 | 30.9 |
| 21. Industrial supplies not elsewhere specified, primary | 12,977 | 0.9 | 51,607 | -74.9 |
| 22. Industrial supplies not elsewhere specified, processed | 305,184 | 22.2 | 191,516 | 59.4 |
| 3. Fuels and lubricants | 326 | 0.0 | 602 | -45.9 |
| 31. Fuels and lubricants, primary | 0 | 0.0 | 0 | .. |
| 32. Fuels and lubricants, processed | 326 | 0.0 | 602 | -45.9 |
| 322. Fuels and lubricants, other | 326 | 0.0 | 602 | -45.9 |
| 4. Capital goods (except transport equipment), and parts and accessories thereof | 647,049 | 47.1 | 312,962 | 106.8 |
| 41. Capital goods (except transport equipment) | 460,757 | 33.6 | 234,580 | 96.4 |
| 42. Capital goods (except transport equipment), parts and accessories | 186,292 | 13.6 | 78,381 | 137.7 |
| 5. Transport equipment and parts and accessories thereof | 93,574 | 6.8 | 91,268 | 2.5 |
| 51. Passenger motor vehicles | 14,158 | 1.0 | 13,241 | 6.9 |
| 52. Transport equipment, other than passenger motor vehicles | 5,252 | 0.4 | 4,549 | 15.5 |
| 521. Transport equipment, other than passenger motor vehicles, industrial | 2,612 | 0.2 | 3,311 | -21.1 |
| 522. Transport equipment, other than passenger motor vehicles, non-industrial | 2,641 | 0.2 | 1,238 | 113.3 |
| 53. Transport equipment, parts and accessories | 74,164 | 5.4 | 73,478 | 0.9 |
| 6. Consumer goods not elsewhere specified | 268,040 | 19.5 | 185,128 | 44.8 |
| 61. Consumer goods not elsewhere specified, durable | 54,745 | 4.0 | 35,263 | 55.3 |
| 62. Consumer goods not elsewhere specified, semi-durable | 167,729 | 12.2 | 116,470 | 44.0 |
| 63. Consumer goods not elsewhere specified, non-durable | 45,566 | 3.3 | 33,395 | 36.4 |
| 7. Goods not elsewhere specified | 9,722 | 0.7 | 22,473 | -56.7 |
| All groups | 1,372,748 | 100.0 | 886,970 | 54.8 |
| Classification | Description | Year level | Quarter level | Month level | Year 2026 sofar |
|---|---|---|---|---|---|
| SITC | Standard International Trade Classification (classification system is maintained by the United Nations) | ███ | ███ | ███ | ███ |
| BEC | The standard of statistical classification of BEC (Broad Economic Categories) is upheld by the UN and it is based on SITC-nomenclature. | ███ | ███ | ███ | ███ |
| NACE | National industrial classification based on Statistical Classification of Economic Activities in the European Community Nomenclature générale des Activités économiques dans les Communautés européennes | ███ | ███ | ███ | ███ |
| CPA | CPA = Classification of Products by Activities | ███ | ███ | ███ | ███ |
| CN | The Combined Nomenclature is the common nomenclature of the European Community. | ███ | ███ | ███ | ███ |