
| Export of goods from Finland and import to Finland | BEC (Broad Economic Categories) |
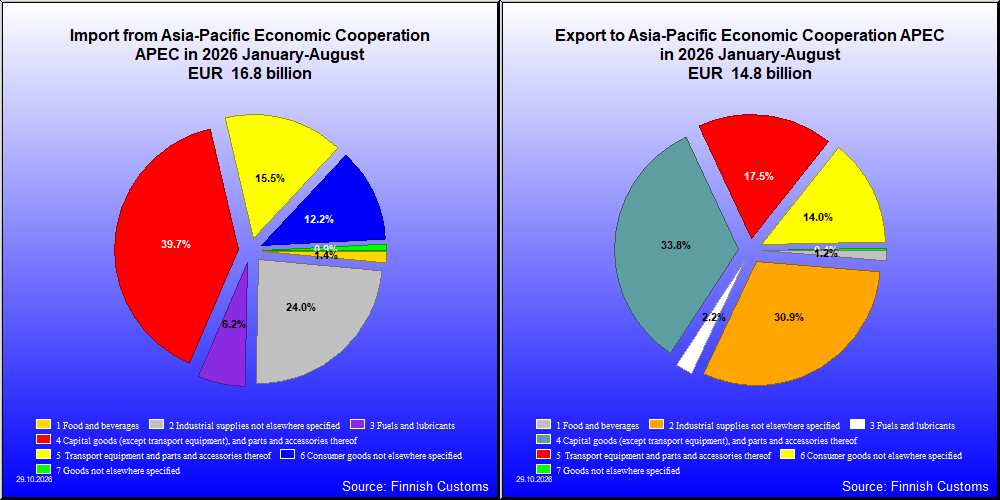
| 2026 1-8 1,000 € | 2025 1-8 1,000 € | Change % |
|
|---|---|---|---|
| 1. Food and beverages | 180,428 | 182,923 | -1.4 |
| 11. Food and beverages, primary | 9,054 | 6,799 | 33.2 |
| 111. Food and beverages, primary, mainly for industry | 22 | 49 | -54.8 |
| 112. Food and beverages, primary, mainly for household consumption | 9,031 | 6,750 | 33.8 |
| 12. Food and beverages, processed | 171,374 | 176,124 | -2.7 |
| 121. Food and beverages, processed, mainly for industry | 79,235 | 76,513 | 3.6 |
| 122. Food and beverages, processed, mainly for household consumption | 92,140 | 99,611 | -7.5 |
| 2. Industrial supplies not elsewhere specified | 4,574,170 | 4,580,134 | -0.1 |
| 21. Industrial supplies not elsewhere specified, primary | 472,327 | 265,304 | 78.0 |
| 22. Industrial supplies not elsewhere specified, processed | 4,101,843 | 4,314,830 | -4.9 |
| 3. Fuels and lubricants | 326,789 | 148,769 | 119.7 |
| 31. Fuels and lubricants, primary | 3,351 | 3,886 | -13.8 |
| 32. Fuels and lubricants, processed | 323,438 | 144,883 | 123.2 |
| 321. Fuels and lubricants, motor spirit | 322,112 | 143,705 | 124.1 |
| 322. Fuels and lubricants, other | 1,325 | 1,178 | 12.5 |
| 4. Capital goods (except transport equipment), and parts and accessories thereof | 5,009,702 | 4,484,801 | 11.7 |
| 41. Capital goods (except transport equipment) | 3,557,398 | 3,183,588 | 11.7 |
| 42. Capital goods (except transport equipment), parts and accessories | 1,452,303 | 1,301,213 | 11.6 |
| 5. Transport equipment and parts and accessories thereof | 2,599,063 | 2,565,109 | 1.3 |
| 51. Passenger motor vehicles | 1,150 | 1,372 | -16.2 |
| 52. Transport equipment, other than passenger motor vehicles | 2,264,435 | 2,281,362 | -0.7 |
| 521. Transport equipment, other than passenger motor vehicles, industrial | 2,226,304 | 2,251,936 | -1.1 |
| 522. Transport equipment, other than passenger motor vehicles, non-industrial | 38,131 | 29,544 | 29.1 |
| 53. Transport equipment, parts and accessories | 333,478 | 282,477 | 18.1 |
| 6. Consumer goods not elsewhere specified | 2,077,822 | 278,198 | 646.9 |
| 61. Consumer goods not elsewhere specified, durable | 77,607 | 80,477 | -3.6 |
| 62. Consumer goods not elsewhere specified, semi-durable | 114,061 | 113,156 | 0.8 |
| 63. Consumer goods not elsewhere specified, non-durable | 1,886,155 | 84,566 | .. |
| 7. Goods not elsewhere specified | 52,811 | 63,760 | -17.2 |
| All groups | 14,820,784 | 12,303,693 | 20.5 |
| 2026 1-8 1,000 € | 2025 1-8 1,000 € | Change % |
|
|---|---|---|---|
| 1. Food and beverages | 243,171 | 211,248 | 15.1 |
| 11. Food and beverages, primary | 71,917 | 53,521 | 34.4 |
| 111. Food and beverages, primary, mainly for industry | 12,884 | 8,944 | 44.1 |
| 112. Food and beverages, primary, mainly for household consumption | 59,033 | 44,577 | 32.4 |
| 12. Food and beverages, processed | 171,261 | 157,727 | 8.6 |
| 121. Food and beverages, processed, mainly for industry | 4,223 | 1,719 | 145.7 |
| 122. Food and beverages, processed, mainly for household consumption | 167,849 | 156,008 | 7.6 |
| 2. Industrial supplies not elsewhere specified | 4,033,516 | 2,943,580 | 37.0 |
| 21. Industrial supplies not elsewhere specified, primary | 1,121,194 | 568,499 | 97.2 |
| 22. Industrial supplies not elsewhere specified, processed | 2,912,321 | 2,375,081 | 22.6 |
| 3. Fuels and lubricants | 1,043,374 | 1,014,412 | 2.9 |
| 31. Fuels and lubricants, primary | 613,667 | 561,598 | 9.3 |
| 32. Fuels and lubricants, processed | 429,707 | 452,814 | -5.1 |
| 321. Fuels and lubricants, motor spirit | 35 | 22 | 57.0 |
| 322. Fuels and lubricants, other | 429,673 | 452,792 | -5.1 |
| 4. Capital goods (except transport equipment), and parts and accessories thereof | 6,682,818 | 4,262,730 | 56.8 |
| 41. Capital goods (except transport equipment) | 4,722,440 | 3,128,464 | 51.0 |
| 42. Capital goods (except transport equipment), parts and accessories | 1,960,378 | 1,134,266 | 72.8 |
| 5. Transport equipment and parts and accessories thereof | 2,615,677 | 1,488,769 | 75.7 |
| 51. Passenger motor vehicles | 424,154 | 384,865 | 10.2 |
| 52. Transport equipment, other than passenger motor vehicles | 1,085,228 | 183,414 | 491.7 |
| 521. Transport equipment, other than passenger motor vehicles, industrial | 1,003,312 | 98,575 | 917.8 |
| 522. Transport equipment, other than passenger motor vehicles, non-industrial | 81,916 | 84,839 | -3.4 |
| 53. Transport equipment, parts and accessories | 1,106,326 | 920,490 | 20.2 |
| 6. Consumer goods not elsewhere specified | 2,059,618 | 1,551,359 | 32.8 |
| 61. Consumer goods not elsewhere specified, durable | 519,625 | 407,737 | 27.4 |
| 62. Consumer goods not elsewhere specified, semi-durable | 1,129,446 | 837,621 | 34.8 |
| 63. Consumer goods not elsewhere specified, non-durable | 410,547 | 306,001 | 34.2 |
| 7. Goods not elsewhere specified | 150,982 | 174,628 | -13.5 |
| All groups | 16,829,156 | 11,646,726 | 44.5 |
| Classification | Description | Year level | Quarter level | Month level | Year 2026 sofar |
|---|---|---|---|---|---|
| SITC | Standard International Trade Classification (classification system is maintained by the United Nations) | ███ | ███ | ███ | ███ |
| BEC | The standard of statistical classification of BEC (Broad Economic Categories) is upheld by the UN and it is based on SITC-nomenclature. | ███ | ███ | ███ | ███ |
| NACE | National industrial classification based on Statistical Classification of Economic Activities in the European Community Nomenclature générale des Activités économiques dans les Communautés européennes | ███ | ███ | ███ | ███ |
| CPA | CPA = Classification of Products by Activities | ███ | ███ | ███ | ███ |
| CN | The Combined Nomenclature is the common nomenclature of the European Community. | ███ | ███ | ███ | ███ |