
| Export of goods from Finland and import to Finland | BEC (Broad Economic Categories) |
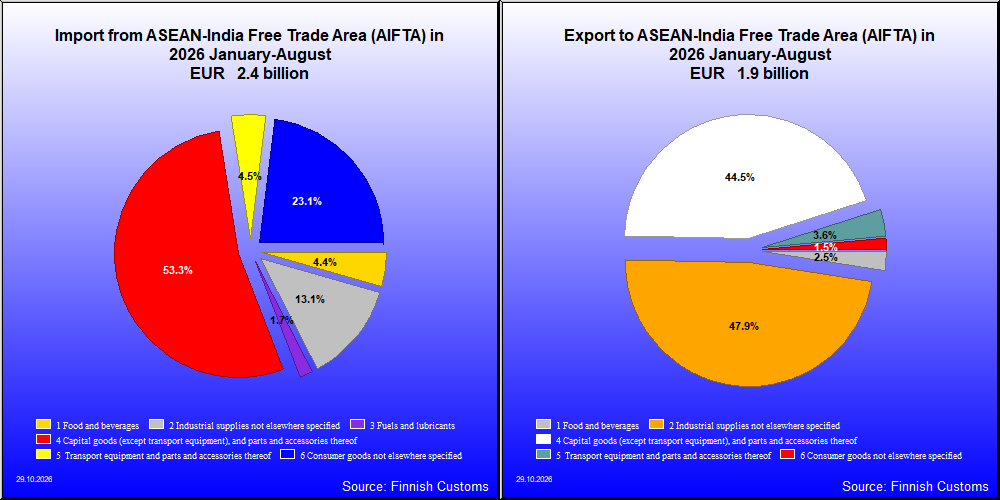
| 2026 1-8 1,000 € | 2025 1-8 1,000 € | Change % |
|
|---|---|---|---|
| 1. Food and beverages | 104,849 | 93,781 | 11.8 |
| 11. Food and beverages, primary | 22,572 | 18,090 | 24.8 |
| 111. Food and beverages, primary, mainly for industry | 2,720 | 3,233 | -15.9 |
| 112. Food and beverages, primary, mainly for household consumption | 19,852 | 14,857 | 33.6 |
| 12. Food and beverages, processed | 82,277 | 75,691 | 8.7 |
| 121. Food and beverages, processed, mainly for industry | 1,388 | 967 | 43.5 |
| 122. Food and beverages, processed, mainly for household consumption | 80,889 | 74,724 | 8.3 |
| 2. Industrial supplies not elsewhere specified | 311,486 | 211,321 | 47.4 |
| 21. Industrial supplies not elsewhere specified, primary | 29,721 | 30,084 | -1.2 |
| 22. Industrial supplies not elsewhere specified, processed | 281,766 | 181,237 | 55.5 |
| 3. Fuels and lubricants | 40,918 | 73,847 | -44.6 |
| 31. Fuels and lubricants, primary | 0 | 0 | .. |
| 32. Fuels and lubricants, processed | 40,918 | 73,847 | -44.6 |
| 322. Fuels and lubricants, other | 40,918 | 73,847 | -44.6 |
| 4. Capital goods (except transport equipment), and parts and accessories thereof | 1,271,900 | 671,822 | 89.3 |
| 41. Capital goods (except transport equipment) | 944,829 | 497,885 | 89.8 |
| 42. Capital goods (except transport equipment), parts and accessories | 327,072 | 173,937 | 88.0 |
| 5. Transport equipment and parts and accessories thereof | 106,381 | 80,952 | 31.4 |
| 51. Passenger motor vehicles | 8,203 | 168 | .. |
| 52. Transport equipment, other than passenger motor vehicles | 12,823 | 8,388 | 52.9 |
| 521. Transport equipment, other than passenger motor vehicles, industrial | 3,771 | 1,737 | 117.1 |
| 522. Transport equipment, other than passenger motor vehicles, non-industrial | 9,053 | 6,651 | 36.1 |
| 53. Transport equipment, parts and accessories | 85,385 | 72,396 | 17.9 |
| 6. Consumer goods not elsewhere specified | 550,604 | 416,029 | 32.3 |
| 61. Consumer goods not elsewhere specified, durable | 79,447 | 69,671 | 14.0 |
| 62. Consumer goods not elsewhere specified, semi-durable | 366,908 | 250,890 | 46.2 |
| 63. Consumer goods not elsewhere specified, non-durable | 104,249 | 95,469 | 9.2 |
| 7. Goods not elsewhere specified | 2,023 | 1,630 | 24.1 |
| All groups | 2,388,133 | 1,549,383 | 54.1 |
| Classification | Description | Year level | Quarter level | Month level | Year 2026 sofar |
|---|---|---|---|---|---|
| SITC | Standard International Trade Classification (classification system is maintained by the United Nations) | ███ | ███ | ███ | ███ |
| BEC | The standard of statistical classification of BEC (Broad Economic Categories) is upheld by the UN and it is based on SITC-nomenclature. | ███ | ███ | ███ | ███ |
| NACE | National industrial classification based on Statistical Classification of Economic Activities in the European Community Nomenclature générale des Activités économiques dans les Communautés européennes | ███ | ███ | ███ | ███ |
| CPA | CPA = Classification of Products by Activities | ███ | ███ | ███ | ███ |
| CN | The Combined Nomenclature is the common nomenclature of the European Community. | ███ | ███ | ███ | ███ |