
| Export of goods from Finland and import to Finland | BEC (Broad Economic Categories) |
*) The standard of statistical classification of BEC (Broad Economic Categories) is upheld by the UN and it is based on SITC-nomenclature.
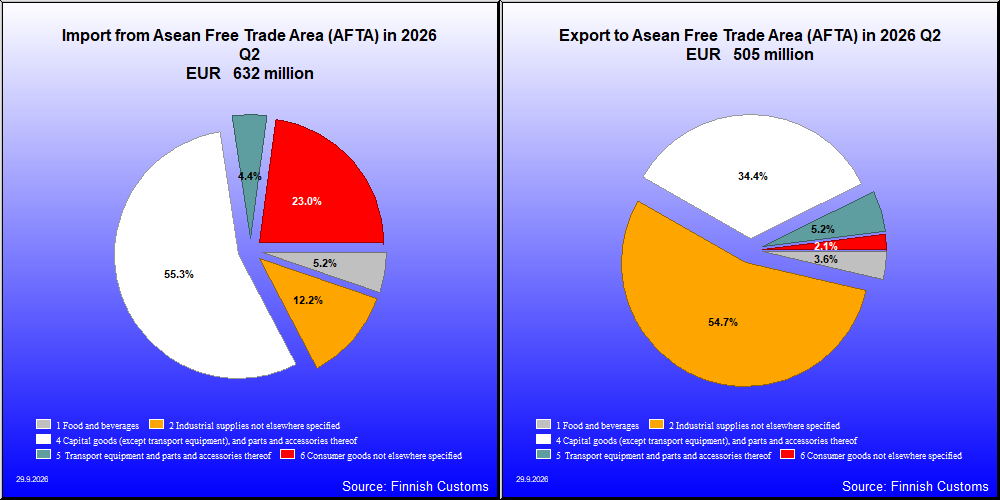
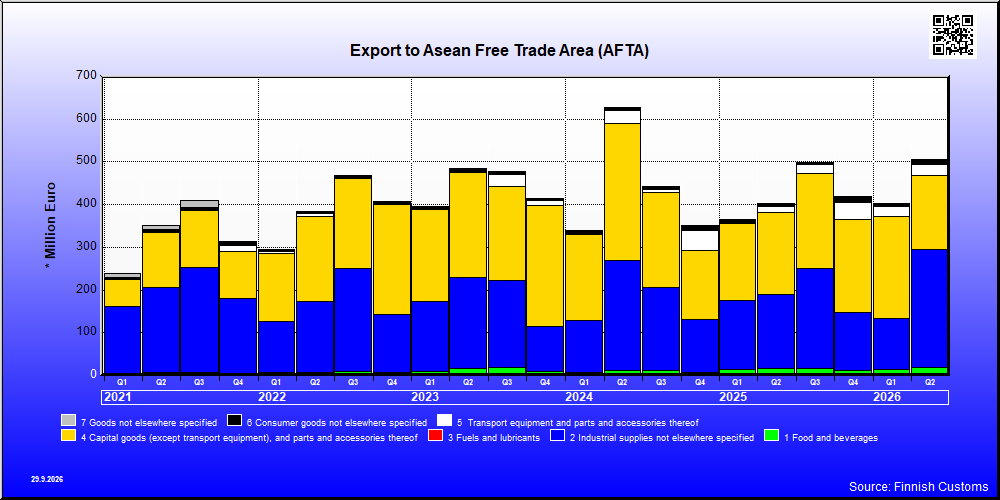
| Q2 / 2026 | Q2 / 2025 | Muutos edellisestä vastaavasta kaudesta % | ||
|---|---|---|---|---|
| 1,000 € | % | 1,000 € | ||
| 1. Food and beverages | 18,212 | 3.6 | 15,282 | 19.2 |
| 11. Food and beverages, primary | 1,852 | 0.4 | 1,785 | 3.7 |
| 111. Food and beverages, primary, mainly for industry | 1 | 0.0 | 0 | 25.0 |
| 112. Food and beverages, primary, mainly for household consumption | 1,851 | 0.4 | 1,784 | 3.7 |
| 12. Food and beverages, processed | 16,360 | 3.2 | 13,497 | 21.2 |
| 121. Food and beverages, processed, mainly for industry | 13,704 | 2.7 | 10,726 | 27.8 |
| 122. Food and beverages, processed, mainly for household consumption | 2,656 | 0.5 | 2,771 | -4.1 |
| 2. Industrial supplies not elsewhere specified | 276,802 | 54.7 | 173,676 | 59.4 |
| 21. Industrial supplies not elsewhere specified, primary | 153,637 | 30.3 | 68,655 | 123.8 |
| 22. Industrial supplies not elsewhere specified, processed | 123,165 | 24.3 | 105,021 | 17.3 |
| 3. Fuels and lubricants | 32 | 0.0 | 25 | 27.8 |
| 32. Fuels and lubricants, processed | 32 | 0.0 | 25 | 27.8 |
| 322. Fuels and lubricants, other | 32 | 0.0 | 25 | 27.8 |
| 4. Capital goods (except transport equipment), and parts and accessories thereof | 174,358 | 34.4 | 191,873 | -9.1 |
| 41. Capital goods (except transport equipment) | 76,999 | 15.2 | 95,339 | -19.2 |
| 42. Capital goods (except transport equipment), parts and accessories | 97,359 | 19.2 | 96,534 | 0.9 |
| 5. Transport equipment and parts and accessories thereof | 26,412 | 5.2 | 15,685 | 68.4 |
| 51. Passenger motor vehicles | 0 | 0 | 308 | .. |
| 52. Transport equipment, other than passenger motor vehicles | 2,932 | 0.6 | 2,503 | 17.1 |
| 521. Transport equipment, other than passenger motor vehicles, industrial | 2,932 | 0.6 | 2,503 | 17.1 |
| 53. Transport equipment, parts and accessories | 23,480 | 4.6 | 12,874 | 82.4 |
| 6. Consumer goods not elsewhere specified | 10,608 | 2.1 | 5,858 | 81.1 |
| 61. Consumer goods not elsewhere specified, durable | 701 | 0.1 | 476 | 47.4 |
| 62. Consumer goods not elsewhere specified, semi-durable | 3,921 | 0.8 | 2,405 | 63.0 |
| 63. Consumer goods not elsewhere specified, non-durable | 5,985 | 1.2 | 2,977 | 101.0 |
| 7. Goods not elsewhere specified | 0 | 0.0 | 2 | -77.0 |
| All groups | 506,424 | 100.0 | 402,401 | 25.9 |
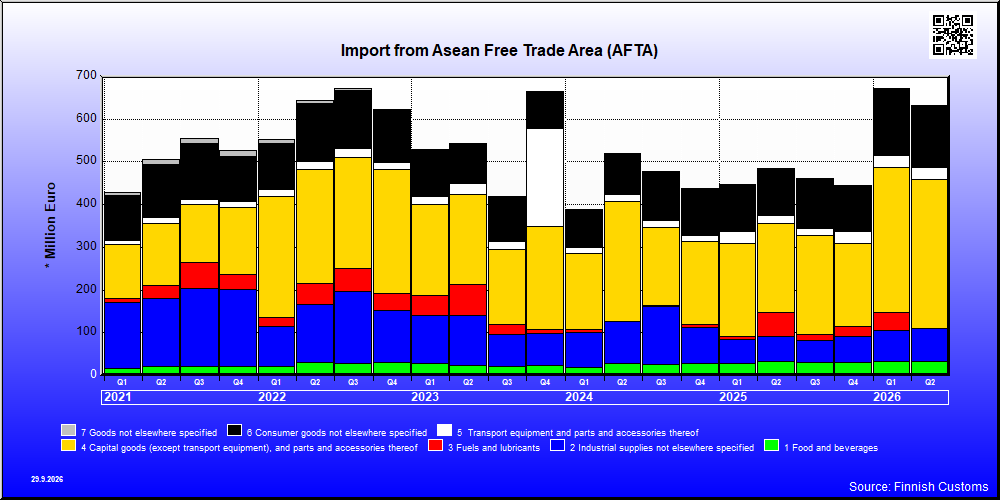
| Q2 / 2026 | Q2 / 2025 | Muutos edellisestä vastaavasta kaudesta % | ||
|---|---|---|---|---|
| 1,000 € | % | 1,000 € | ||
| 1. Food and beverages | 33,607 | 5.3 | 33,074 | 1.6 |
| 11. Food and beverages, primary | 5,793 | 0.9 | 5,136 | 12.8 |
| 111. Food and beverages, primary, mainly for industry | 686 | 0.1 | 1,202 | -42.9 |
| 112. Food and beverages, primary, mainly for household consumption | 5,107 | 0.8 | 3,934 | 29.8 |
| 12. Food and beverages, processed | 27,813 | 4.4 | 27,938 | -0.4 |
| 121. Food and beverages, processed, mainly for industry | 664 | 0.1 | 168 | 295.1 |
| 122. Food and beverages, processed, mainly for household consumption | 27,150 | 4.3 | 27,770 | -2.2 |
| 2. Industrial supplies not elsewhere specified | 76,886 | 12.2 | 58,730 | 30.9 |
| 21. Industrial supplies not elsewhere specified, primary | 7,517 | 1.2 | 8,628 | -12.9 |
| 22. Industrial supplies not elsewhere specified, processed | 69,369 | 11.0 | 50,102 | 38.5 |
| 3. Fuels and lubricants | 156 | 0.0 | 55,558 | -99.7 |
| 32. Fuels and lubricants, processed | 156 | 0.0 | 55,558 | -99.7 |
| 322. Fuels and lubricants, other | 156 | 0.0 | 55,558 | -99.7 |
| 4. Capital goods (except transport equipment), and parts and accessories thereof | 345,926 | 54.8 | 207,718 | 66.5 |
| 41. Capital goods (except transport equipment) | 258,462 | 40.9 | 168,257 | 53.6 |
| 42. Capital goods (except transport equipment), parts and accessories | 87,464 | 13.9 | 39,461 | 121.6 |
| 5. Transport equipment and parts and accessories thereof | 28,623 | 4.5 | 19,250 | 48.7 |
| 51. Passenger motor vehicles | 1 | 0.0 | 134 | -99.6 |
| 52. Transport equipment, other than passenger motor vehicles | 6,162 | 1.0 | 3,420 | 80.2 |
| 521. Transport equipment, other than passenger motor vehicles, industrial | 1,339 | 0.2 | 921 | 45.5 |
| 522. Transport equipment, other than passenger motor vehicles, non-industrial | 4,823 | 0.8 | 2,499 | 93.0 |
| 53. Transport equipment, parts and accessories | 22,491 | 3.6 | 15,696 | 43.3 |
| 6. Consumer goods not elsewhere specified | 145,774 | 23.1 | 110,520 | 31.9 |
| 61. Consumer goods not elsewhere specified, durable | 23,218 | 3.7 | 24,996 | -7.1 |
| 62. Consumer goods not elsewhere specified, semi-durable | 107,117 | 17.0 | 73,552 | 45.6 |
| 63. Consumer goods not elsewhere specified, non-durable | 15,439 | 2.4 | 11,972 | 29.0 |
| 7. Goods not elsewhere specified | 387 | 0.1 | 253 | 53.1 |
| All groups | 631,359 | 100.0 | 485,102 | 30.1 |
| Classification | Description | Year level | Quarter level | Month level | Year 2026 sofar |
|---|---|---|---|---|---|
| SITC | Standard International Trade Classification (classification system is maintained by the United Nations) | ███ | ███ | ███ | ███ |
| BEC | The standard of statistical classification of BEC (Broad Economic Categories) is upheld by the UN and it is based on SITC-nomenclature. | ███ | ███ | ███ | ███ |
| NACE | National industrial classification based on Statistical Classification of Economic Activities in the European Community Nomenclature générale des Activités économiques dans les Communautés européennes | ███ | ███ | ███ | ███ |
| CPA | CPA = Classification of Products by Activities | ███ | ███ | ███ | ███ |
| CN | The Combined Nomenclature is the common nomenclature of the European Community. | ███ | ███ | ███ | ███ |