
| Export of goods from Finland and import to Finland | BEC (Broad Economic Categories) |
*) The standard of statistical classification of BEC (Broad Economic Categories) is upheld by the UN and it is based on SITC-nomenclature.

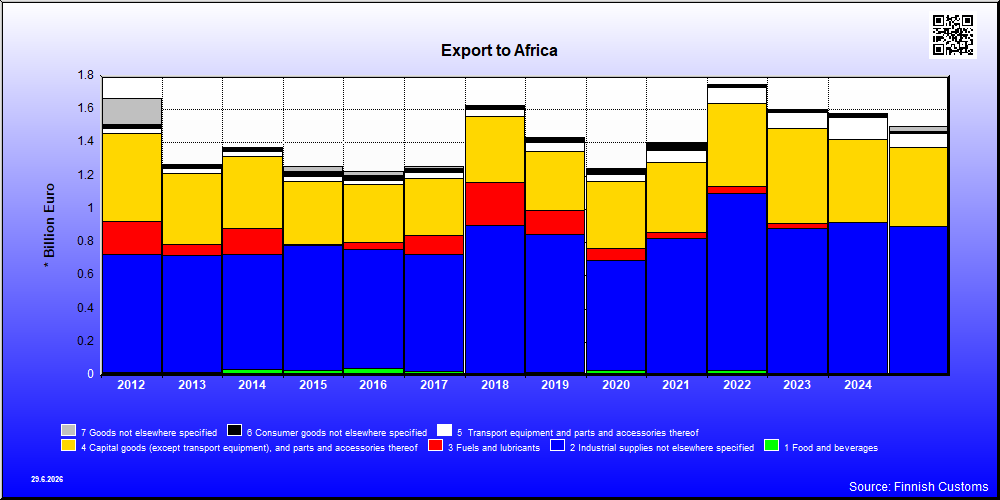
| 2021 | 2022 | 2023 | 2024 | 2025 | ||||||
|---|---|---|---|---|---|---|---|---|---|---|
| 1,000 € | % | 1,000 € | % | 1,000 € | % | 1,000 € | % | 1,000 € | % | |
| 1. Food and beverages | 14,168 | 1.0 | 28,203 | 1.6 | 9,963 | 0.6 | 13,024 | 0.8 | 13,552 | 0.9 |
| 11. Food and beverages, primary | 5,582 | 0.4 | 19,855 | 1.1 | 2 | 0.0 | 1 | 0.0 | 2 | 0.0 |
| 111. Food and beverages, primary, mainly for industry | 5,582 | 0.4 | 19,803 | 1.1 | 2 | 0.0 | 1 | 0.0 | 2 | 0.0 |
| 112. Food and beverages, primary, mainly for household consumption | 52 | 0.0 | ||||||||
| 12. Food and beverages, processed | 8,585 | 0.6 | 8,348 | 0.5 | 9,962 | 0.6 | 13,023 | 0.8 | 13,550 | 0.9 |
| 121. Food and beverages, processed, mainly for industry | 6,670 | 0.5 | 6,388 | 0.4 | 7,835 | 0.5 | 10,963 | 0.7 | 10,536 | 0.7 |
| 122. Food and beverages, processed, mainly for household consumption | 1,916 | 0.1 | 1,960 | 0.1 | 2,127 | 0.1 | 2,060 | 0.1 | 3,014 | 0.2 |
| 2. Industrial supplies not elsewhere specified | 813,108 | 57.9 | 1,064,525 | 60.8 | 871,980 | 54.4 | 905,272 | 57.4 | 880,527 | 58.7 |
| 21. Industrial supplies not elsewhere specified, primary | 12,451 | 0.9 | 13,835 | 0.8 | 11,051 | 0.7 | 16,090 | 1.0 | 15,224 | 1.0 |
| 22. Industrial supplies not elsewhere specified, processed | 800,657 | 57.0 | 1,050,689 | 60.0 | 860,929 | 53.7 | 889,183 | 56.3 | 865,303 | 57.7 |
| 3. Fuels and lubricants | 34,166 | 2.4 | 44,000 | 2.5 | 31,710 | 2.0 | 4,445 | 0.3 | 450 | 0.0 |
| 31. Fuels and lubricants, primary | 883 | 0.1 | 938 | 0.1 | 471 | 0.0 | 689 | 0.0 | 409 | 0.0 |
| 32. Fuels and lubricants, processed | 33,283 | 2.4 | 43,062 | 2.5 | 31,239 | 1.9 | 3,756 | 0.2 | 42 | 0.0 |
| 321. Fuels and lubricants, motor spirit | 33,257 | 2.4 | 15 | 0.0 | 31,216 | 1.9 | ||||
| 322. Fuels and lubricants, other | 26 | 0.0 | 43,047 | 2.5 | 23 | 0.0 | 3,756 | 0.2 | 42 | 0.0 |
| 4. Capital goods (except transport equipment), and parts and accessories thereof | 421,486 | 30.0 | 500,601 | 28.6 | 574,811 | 35.9 | 497,522 | 31.5 | 475,689 | 31.7 |
| 41. Capital goods (except transport equipment) | 290,539 | 20.7 | 380,964 | 21.8 | 413,412 | 25.8 | 358,182 | 22.7 | 353,385 | 23.6 |
| 42. Capital goods (except transport equipment), parts and accessories | 130,948 | 9.3 | 119,639 | 6.8 | 161,398 | 10.1 | 140,419 | 8.9 | 122,312 | 8.2 |
| 5. Transport equipment and parts and accessories thereof | 69,119 | 4.9 | 95,597 | 5.5 | 97,701 | 6.1 | 135,072 | 8.6 | 88,585 | 5.9 |
| 51. Passenger motor vehicles | 1,911 | 0.1 | 5,002 | 0.3 | 2,472 | 0.2 | 1,941 | 0.1 | 2,106 | 0.1 |
| 52. Transport equipment, other than passenger motor vehicles | 62,720 | 4.5 | 83,032 | 4.7 | 89,846 | 5.6 | 128,735 | 8.2 | 61,604 | 4.1 |
| 521. Transport equipment, other than passenger motor vehicles, industrial | 61,387 | 4.4 | 82,959 | 4.7 | 89,743 | 5.6 | 128,489 | 8.1 | 60,588 | 4.0 |
| 522. Transport equipment, other than passenger motor vehicles, non-industrial | 1,333 | 0.1 | 73 | 0.0 | 104 | 0.0 | 246 | 0.0 | 1,017 | 0.1 |
| 53. Transport equipment, parts and accessories | 4,488 | 0.3 | 7,562 | 0.4 | 5,383 | 0.3 | 4,396 | 0.3 | 24,891 | 1.7 |
| 6. Consumer goods not elsewhere specified | 50,967 | 3.6 | 16,204 | 0.9 | 13,636 | 0.9 | 20,153 | 1.3 | 11,963 | 0.8 |
| 61. Consumer goods not elsewhere specified, durable | 3,524 | 0.3 | 2,797 | 0.2 | 3,487 | 0.2 | 3,849 | 0.2 | 2,953 | 0.2 |
| 62. Consumer goods not elsewhere specified, semi-durable | 1,549 | 0.1 | 3,423 | 0.2 | 2,075 | 0.1 | 3,944 | 0.2 | 2,491 | 0.2 |
| 63. Consumer goods not elsewhere specified, non-durable | 45,894 | 3.3 | 9,983 | 0.6 | 8,101 | 0.5 | 12,362 | 0.8 | 6,521 | 0.4 |
| 7. Goods not elsewhere specified | 2,287 | 0.2 | 2,006 | 0.1 | 2,390 | 0.1 | 4,523 | 0.3 | 29,790 | 2.0 |
| All groups | 1,405,294 | 100.0 | 1,751,135 | 100.0 | 1,602,191 | 100.0 | 1,578,132 | 100.0 | 1,500,539 | 100.0 |
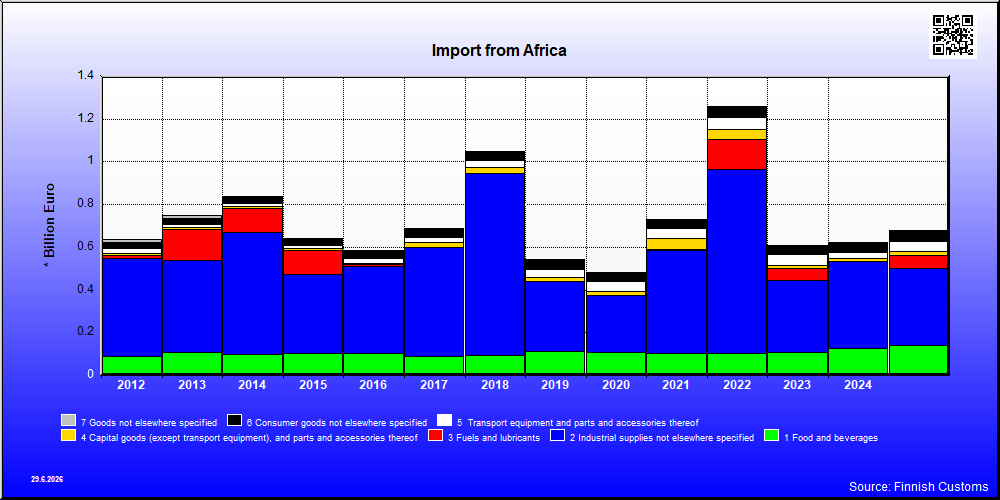
| 2021 | 2022 | 2023 | 2024 | 2025 | ||||||
|---|---|---|---|---|---|---|---|---|---|---|
| 1,000 € | % | 1,000 € | % | 1,000 € | % | 1,000 € | % | 1,000 € | % | |
| 1. Food and beverages | 104,743 | 14.3 | 102,550 | 8.1 | 105,540 | 17.3 | 127,453 | 20.5 | 141,108 | 21.0 |
| 11. Food and beverages, primary | 80,532 | 11.0 | 77,111 | 6.1 | 85,430 | 14.0 | 103,084 | 16.6 | 118,007 | 17.6 |
| 111. Food and beverages, primary, mainly for industry | 22,504 | 3.1 | 30,108 | 2.4 | 25,571 | 4.2 | 29,110 | 4.7 | 30,523 | 4.5 |
| 112. Food and beverages, primary, mainly for household consumption | 58,028 | 7.9 | 47,003 | 3.7 | 59,858 | 9.8 | 73,975 | 11.9 | 87,484 | 13.0 |
| 12. Food and beverages, processed | 24,211 | 3.3 | 25,439 | 2.0 | 20,112 | 3.3 | 24,369 | 3.9 | 23,101 | 3.4 |
| 121. Food and beverages, processed, mainly for industry | 1,547 | 0.2 | 571 | 0.0 | 820 | 0.1 | 1,072 | 0.2 | 862 | 0.1 |
| 122. Food and beverages, processed, mainly for household consumption | 22,665 | 3.1 | 24,869 | 2.0 | 19,291 | 3.2 | 23,297 | 3.7 | 22,239 | 3.3 |
| 2. Industrial supplies not elsewhere specified | 478,548 | 65.6 | 862,873 | 68.5 | 340,065 | 55.7 | 407,561 | 65.5 | 357,843 | 53.3 |
| 21. Industrial supplies not elsewhere specified, primary | 50,701 | 6.9 | 59,952 | 4.8 | 86,554 | 14.2 | 194,053 | 31.2 | 132,886 | 19.8 |
| 22. Industrial supplies not elsewhere specified, processed | 427,847 | 58.6 | 802,921 | 63.7 | 253,511 | 41.5 | 213,508 | 34.3 | 224,958 | 33.5 |
| 3. Fuels and lubricants | 5,782 | 0.8 | 137,330 | 10.9 | 55,901 | 9.2 | 150 | 0.0 | 63,295 | 9.4 |
| 31. Fuels and lubricants, primary | 102,389 | 8.1 | 28,003 | 4.6 | 55,432 | 8.3 | ||||
| 32. Fuels and lubricants, processed | 5,781 | 0.8 | 34,941 | 2.8 | 27,898 | 4.6 | 150 | 0.0 | 7,863 | 1.2 |
| 321. Fuels and lubricants, motor spirit | 429 | 0.1 | ||||||||
| 322. Fuels and lubricants, other | 5,352 | 0.7 | 34,941 | 2.8 | 27,898 | 4.6 | 150 | 0.0 | 7,863 | 1.2 |
| 4. Capital goods (except transport equipment), and parts and accessories thereof | 54,171 | 7.4 | 47,079 | 3.7 | 11,355 | 1.9 | 14,068 | 2.3 | 19,502 | 2.9 |
| 41. Capital goods (except transport equipment) | 50,063 | 6.9 | 41,737 | 3.3 | 5,828 | 1.0 | 7,251 | 1.2 | 9,100 | 1.4 |
| 42. Capital goods (except transport equipment), parts and accessories | 4,108 | 0.6 | 5,342 | 0.4 | 5,527 | 0.9 | 6,816 | 1.1 | 10,446 | 1.6 |
| 5. Transport equipment and parts and accessories thereof | 44,493 | 6.1 | 59,688 | 4.7 | 54,561 | 8.9 | 27,805 | 4.5 | 47,639 | 7.1 |
| 51. Passenger motor vehicles | 16,732 | 2.3 | 26,932 | 2.1 | 16,345 | 2.7 | 6,311 | 1.0 | 11,342 | 1.7 |
| 52. Transport equipment, other than passenger motor vehicles | 24,595 | 3.4 | 28,703 | 2.3 | 34,131 | 5.6 | 15,524 | 2.5 | 27,943 | 4.2 |
| 521. Transport equipment, other than passenger motor vehicles, industrial | 24,379 | 3.3 | 28,345 | 2.2 | 33,394 | 5.5 | 15,459 | 2.5 | 27,645 | 4.1 |
| 522. Transport equipment, other than passenger motor vehicles, non-industrial | 216 | 0.0 | 358 | 0.0 | 737 | 0.1 | 65 | 0.0 | 298 | 0.0 |
| 53. Transport equipment, parts and accessories | 3,166 | 0.4 | 4,053 | 0.3 | 4,084 | 0.7 | 5,976 | 1.0 | 8,354 | 1.2 |
| 6. Consumer goods not elsewhere specified | 40,860 | 5.6 | 46,641 | 3.7 | 43,207 | 7.1 | 44,790 | 7.2 | 48,276 | 7.2 |
| 61. Consumer goods not elsewhere specified, durable | 7,456 | 1.0 | 5,222 | 0.4 | 6,971 | 1.1 | 9,763 | 1.6 | 7,132 | 1.1 |
| 62. Consumer goods not elsewhere specified, semi-durable | 17,348 | 2.4 | 23,461 | 1.9 | 19,706 | 3.2 | 19,232 | 3.1 | 21,247 | 3.2 |
| 63. Consumer goods not elsewhere specified, non-durable | 16,056 | 2.2 | 17,958 | 1.4 | 16,530 | 2.7 | 15,796 | 2.5 | 19,897 | 3.0 |
| 7. Goods not elsewhere specified | 1,397 | 0.2 | 3,693 | 0.3 | 240 | 0.0 | 136 | 0.0 | 1,397 | 0.2 |
| All groups | 729,964 | 100.0 | 1,259,827 | 100.0 | 610,747 | 100.0 | 621,956 | 100.0 | 671,408 | 100.0 |
| Classification | Description | Year level | Quarter level | Month level | |
|---|---|---|---|---|---|
| SITC | Standard International Trade Classification (classification system is maintained by the United Nations) | ███ | ███ | ███ | |
| BEC | The standard of statistical classification of BEC (Broad Economic Categories) is upheld by the UN and it is based on SITC-nomenclature. | ███ | ███ | ███ | |
| NACE | National industrial classification based on Statistical Classification of Economic Activities in the European Community Nomenclature générale des Activités économiques dans les Communautés européennes | ███ | ███ | ███ | |
| CPA | CPA = Classification of Products by Activities | ███ | ███ | ███ | |
| CN | The Combined Nomenclature is the common nomenclature of the European Community. | ███ | ███ | ███ |