
| Export of goods from Finland and import to Finland | BEC (Broad Economic Categories) |
*) The standard of statistical classification of BEC (Broad Economic Categories) is upheld by the UN and it is based on SITC-nomenclature.
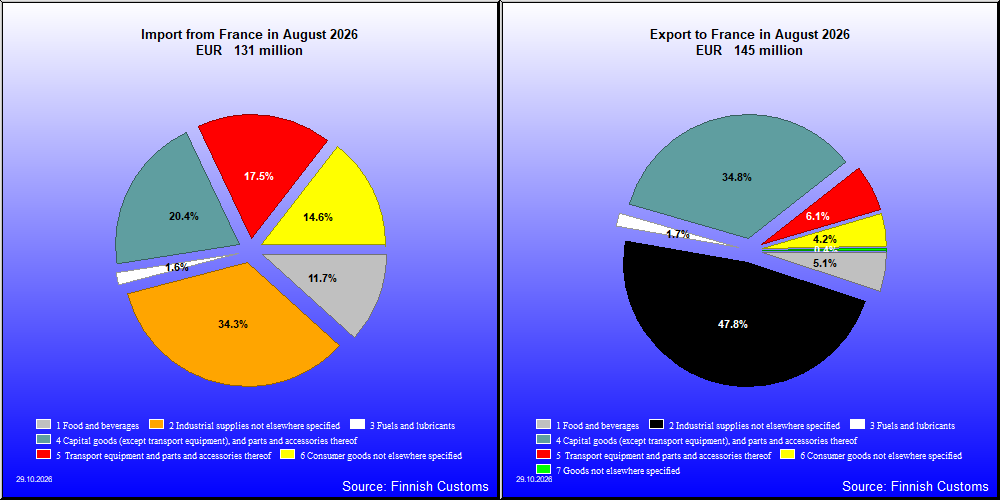
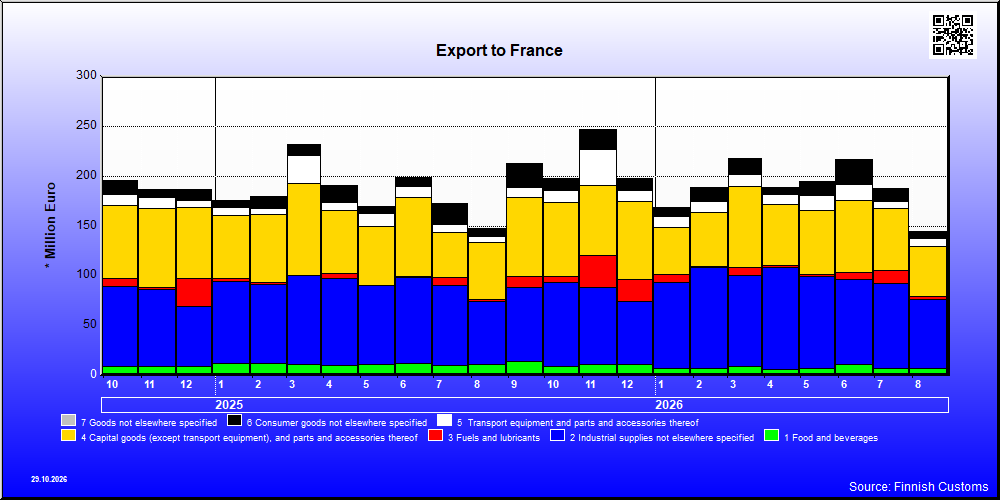
| 8 / 2026 | 8 / 2025 | Change from previous year's equal month % | ||
|---|---|---|---|---|
| 1,000 € | % | 1000 € | ||
| 1. Food and beverages | 7,313 | 5.1 | 11,142 | -34.4 |
| 11. Food and beverages, primary | 2,171 | 1.5 | 2,835 | -23.4 |
| 111. Food and beverages, primary, mainly for industry | 0 | 0 | 1,398 | .. |
| 112. Food and beverages, primary, mainly for household consumption | 2,171 | 1.5 | 1,437 | 51.1 |
| 12. Food and beverages, processed | 5,142 | 3.6 | 8,307 | -38.1 |
| 121. Food and beverages, processed, mainly for industry | 497 | 0.3 | 70 | 607.6 |
| 122. Food and beverages, processed, mainly for household consumption | 4,645 | 3.2 | 8,237 | -43.6 |
| 2. Industrial supplies not elsewhere specified | 69,069 | 47.8 | 62,929 | 9.8 |
| 21. Industrial supplies not elsewhere specified, primary | 1,635 | 1.1 | 1,232 | 32.7 |
| 22. Industrial supplies not elsewhere specified, processed | 67,434 | 46.6 | 61,697 | 9.3 |
| 3. Fuels and lubricants | 2,392 | 1.7 | 1,732 | 38.1 |
| 31. Fuels and lubricants, primary | 0 | 0 | 3 | .. |
| 32. Fuels and lubricants, processed | 2,392 | 1.7 | 1,729 | 38.4 |
| 322. Fuels and lubricants, other | 2,392 | 1.7 | 1,729 | 38.4 |
| 4. Capital goods (except transport equipment), and parts and accessories thereof | 50,250 | 34.8 | 57,644 | -12.8 |
| 41. Capital goods (except transport equipment) | 35,920 | 24.8 | 47,839 | -24.9 |
| 42. Capital goods (except transport equipment), parts and accessories | 14,330 | 9.9 | 9,805 | 46.2 |
| 5. Transport equipment and parts and accessories thereof | 8,854 | 6.1 | 6,192 | 43.0 |
| 51. Passenger motor vehicles | 4 | 0.0 | 0 | .. |
| 52. Transport equipment, other than passenger motor vehicles | 3,725 | 2.6 | 2,512 | 48.3 |
| 521. Transport equipment, other than passenger motor vehicles, industrial | 3,475 | 2.4 | 2,512 | 38.3 |
| 522. Transport equipment, other than passenger motor vehicles, non-industrial | 250 | 0.2 | 0 | .. |
| 53. Transport equipment, parts and accessories | 5,125 | 3.5 | 3,680 | 39.3 |
| 6. Consumer goods not elsewhere specified | 6,108 | 4.2 | 7,280 | -16.1 |
| 61. Consumer goods not elsewhere specified, durable | 1,196 | 0.8 | 797 | 50.0 |
| 62. Consumer goods not elsewhere specified, semi-durable | 3,070 | 2.1 | 2,779 | 10.5 |
| 63. Consumer goods not elsewhere specified, non-durable | 1,842 | 1.3 | 3,704 | -50.3 |
| 7. Goods not elsewhere specified | 583 | 0.4 | 398 | 46.3 |
| All groups | 144,569 | 100.0 | 147,318 | -1.9 |
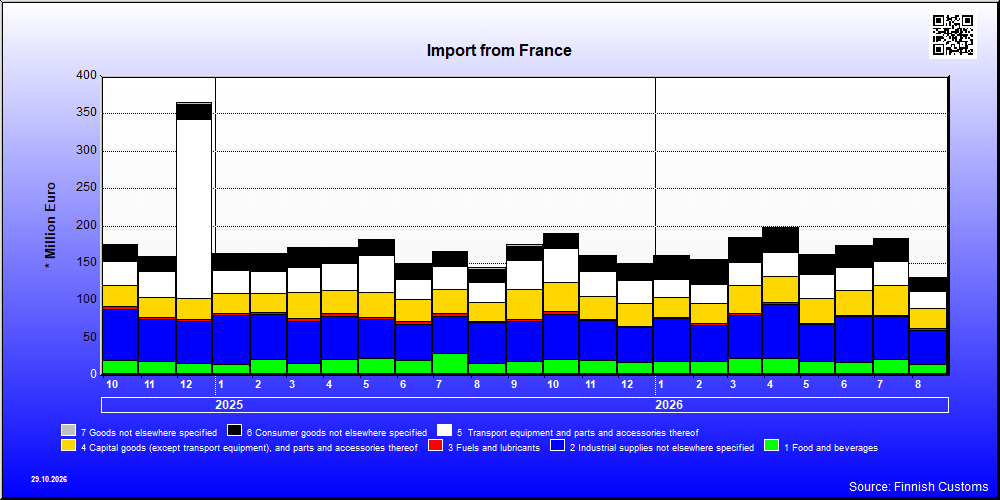
| 8 / 2026 | 8 / 2025 | Change from previous year's equal month % | ||
|---|---|---|---|---|
| 1,000 € | % | 1,000 € | ||
| 1. Food and beverages | 15,379 | 11.7 | 15,891 | -3.2 |
| 11. Food and beverages, primary | 1,250 | 1.0 | 1,471 | -15.1 |
| 111. Food and beverages, primary, mainly for industry | 359 | 0.3 | 17 | .. |
| 112. Food and beverages, primary, mainly for household consumption | 891 | 0.7 | 1,455 | -38.7 |
| 12. Food and beverages, processed | 14,129 | 10.7 | 14,420 | -2.0 |
| 121. Food and beverages, processed, mainly for industry | 769 | 0.6 | 2,883 | -73.3 |
| 122. Food and beverages, processed, mainly for household consumption | 13,360 | 10.2 | 11,537 | 15.8 |
| 2. Industrial supplies not elsewhere specified | 45,050 | 34.3 | 54,629 | -17.5 |
| 21. Industrial supplies not elsewhere specified, primary | 625 | 0.5 | 833 | -25.0 |
| 22. Industrial supplies not elsewhere specified, processed | 44,425 | 33.8 | 53,796 | -17.4 |
| 3. Fuels and lubricants | 2,041 | 1.6 | 1,965 | 3.9 |
| 32. Fuels and lubricants, processed | 2,041 | 1.6 | 1,965 | 3.9 |
| 322. Fuels and lubricants, other | 2,041 | 1.6 | 1,965 | 3.9 |
| 4. Capital goods (except transport equipment), and parts and accessories thereof | 26,777 | 20.4 | 25,436 | 5.3 |
| 41. Capital goods (except transport equipment) | 16,023 | 12.2 | 14,704 | 9.0 |
| 42. Capital goods (except transport equipment), parts and accessories | 10,754 | 8.2 | 10,733 | 0.2 |
| 5. Transport equipment and parts and accessories thereof | 22,925 | 17.4 | 26,878 | -14.7 |
| 51. Passenger motor vehicles | 10,835 | 8.2 | 8,752 | 23.8 |
| 52. Transport equipment, other than passenger motor vehicles | 1,960 | 1.5 | 5,072 | -61.3 |
| 521. Transport equipment, other than passenger motor vehicles, industrial | 1,724 | 1.3 | 4,825 | -64.3 |
| 522. Transport equipment, other than passenger motor vehicles, non-industrial | 237 | 0.2 | 247 | -4.2 |
| 53. Transport equipment, parts and accessories | 10,130 | 7.7 | 13,054 | -22.4 |
| 6. Consumer goods not elsewhere specified | 19,188 | 14.6 | 17,626 | 8.9 |
| 61. Consumer goods not elsewhere specified, durable | 896 | 0.7 | 800 | 12.0 |
| 62. Consumer goods not elsewhere specified, semi-durable | 3,424 | 2.6 | 4,646 | -26.3 |
| 63. Consumer goods not elsewhere specified, non-durable | 14,867 | 11.3 | 12,179 | 22.1 |
| 7. Goods not elsewhere specified | 119 | 0.1 | 1,826 | -93.5 |
| All groups | 131,480 | 100.0 | 144,251 | -8.9 |
| Classification | Description | Year level | Quarter level | Month level | Year 2026 sofar |
|---|---|---|---|---|---|
| SITC | Standard International Trade Classification (classification system is maintained by the United Nations) | ███ | ███ | ███ | ███ |
| BEC | The standard of statistical classification of BEC (Broad Economic Categories) is upheld by the UN and it is based on SITC-nomenclature. | ███ | ███ | ███ | ███ |
| NACE | National industrial classification based on Statistical Classification of Economic Activities in the European Community Nomenclature générale des Activités économiques dans les Communautés européennes | ███ | ███ | ███ | ███ |
| CPA | CPA = Classification of Products by Activities | ███ | ███ | ███ | ███ |
| CN | The Combined Nomenclature is the common nomenclature of the European Community. | ███ | ███ | ███ | ███ |