
| Export of goods from Finland and import to Finland | Trade Balance |
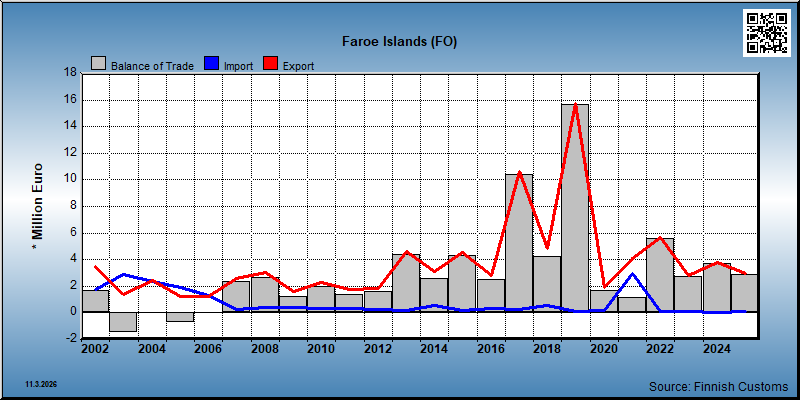
| Year | Import 1,000 € | Export 1,000 € | Trade 1,000 € | Trade balance 1,000 € |
|---|---|---|---|---|
| 2002 | 1,794 | 3,498 | 5,291 | 1,704 |
| 2003 | 2,901 | 1,402 | 4,303 | -1,499 |
| 2004 | 2,358 | 2,407 | 4,765 | 50 |
| 2005 | 1,932 | 1,223 | 3,155 | -709 |
| 2006 | 1,289 | 1,241 | 2,530 | -47 |
| 2007 | 242 | 2,624 | 2,866 | 2,382 |
| 2008 | 385 | 3,043 | 3,428 | 2,658 |
| 2009 | 391 | 1,617 | 2,008 | 1,225 |
| 2010 | 317 | 2,284 | 2,602 | 1,967 |
| 2011 | 364 | 1,740 | 2,105 | 1,376 |
| 2012 | 227 | 1,823 | 2,050 | 1,595 |
| 2013 | 216 | 4,637 | 4,853 | 4,422 |
| 2014 | 536 | 3,111 | 3,647 | 2,576 |
| 2015 | 191 | 4,534 | 4,725 | 4,343 |
| 2016 | 317 | 2,814 | 3,131 | 2,498 |
| 2017 | 222 | 10,642 | 10,864 | 10,421 |
| 2018 | 558 | 4,826 | 5,384 | 4,269 |
| 2019 | 93 | 15,738 | 15,831 | 15,644 |
| 2020 | 190 | 1,891 | 2,080 | 1,701 |
| 2021 | 2,948 | 4,074 | 7,021 | 1,126 |
| 2022 | 98 | 5,661 | 5,759 | 5,562 |
| 2023 | 127 | 2,832 | 2,959 | 2,705 |
| 2024 | 54 | 3,757 | 3,811 | 3,703 |
| 2025 | 69 | 2,965 | 3,034 | 2,895 |
*) SITC = Standard International Trade Classification (classification system is maintained by the United Nations)
| 2021 | 2022 | 2023 | 2024 | 2025 | ||||||
|---|---|---|---|---|---|---|---|---|---|---|
| 1,000 € | % | 1,000 € | % | 1,000 € | % | 1,000 € | % | 1,000 € | % | |
| 2. Crude materials,inedible,except fuels | 3 | 0.1 | ||||||||
| 24. Cork and wood | 3 | 0.1 | ||||||||
| 5. Chemicals and related products,n.e.s. | 2,561 | 62.9 | 2,557 | 45.2 | 1,718 | 68.0 | 1,739 | 48.0 | 1,156 | 39.0 |
| 54. Medicinal and pharmaceutical products | 1 | 0.0 | 1 | 0.0 | ||||||
| 55. Perfume,cleaning etc.preparations | 87 | 2.1 | 167 | 3.0 | 180 | 7.1 | 262 | 7.2 | 211 | 7.1 |
| 57. Plastics in primary forms | 2,450 | 60.1 | 2,372 | 41.9 | 1,514 | 59.9 | 1,444 | 39.8 | 911 | 30.7 |
| 58. Plastics in non-primary forms | 5 | 0.1 | 4 | 0.1 | 11 | 0.5 | 2 | 0.0 | 5 | 0.2 |
| 59. Chemical materials and products,n.e.s. | 19 | 0.5 | 14 | 0.2 | 12 | 0.5 | 31 | 0.8 | 32 | 1.1 |
| 6. Basic manufactures | 321 | 7.9 | 108 | 1.9 | 128 | 5.1 | 268 | 7.4 | 144 | 4.9 |
| 61. Leather,dressed fur,etc. | 2 | 0.1 | 3 | 0.1 | ||||||
| 62. Rubber manufactures,n.e.s. | 2 | 0.0 | 1 | 0.0 | ||||||
| 63. Wood and cork manufactures | 27 | 0.7 | 7 | 0.1 | 207 | 5.7 | 38 | 1.3 | ||
| 64. Paper,paperboard and articles thereof | 3 | 0.1 | ||||||||
| 65. Textile yarn,fabrics,made up articles,etc. | 1 | 0.0 | 1 | 0.0 | 14 | 0.4 | 27 | 0.9 | ||
| 66. Non-metallic mineral manufactures,n.e.s. | 1 | 0.0 | 1 | 0.0 | 3 | 0.1 | 15 | 0.4 | 47 | 1.6 |
| 67. Iron and steel | 131 | 3.2 | 74 | 1.3 | 4 | 0.1 | 1 | 0.0 | ||
| 69. Manufactures of metals,n.e.s. | 163 | 4.0 | 23 | 0.4 | 117 | 4.6 | 30 | 0.8 | 30 | 1.0 |
| 7. Machinery,transport equipment | 834 | 20.5 | 2,879 | 50.9 | 542 | 21.5 | 1,067 | 29.4 | 1,420 | 47.9 |
| 71. Power generating machinery and equipment | 1 | 0.0 | 78 | 1.4 | 47 | 1.9 | 18 | 0.5 | 89 | 3.0 |
| 72. Machinery for specialized industries | 243 | 6.0 | 1,426 | 25.2 | 114 | 4.5 | 478 | 13.2 | 116 | 3.9 |
| 73. Metal working machinery | 20 | 0.5 | 16 | 0.3 | 31 | 1.2 | 20 | 0.5 | 27 | 0.9 |
| 74. General industrial machinery n.e.s. | 222 | 5.5 | 827 | 14.6 | 22 | 0.9 | 124 | 3.4 | 13 | 0.4 |
| 75. Office machines and adp machines | 2 | 0.1 | 2 | 0.1 | 15 | 0.5 | ||||
| 76. Telecommunications and sound recording equipment | 10 | 0.3 | 173 | 3.1 | 9 | 0.4 | 7 | 0.2 | 17 | 0.6 |
| 77. Electric machinery,n.e.s.and parts | 332 | 8.2 | 304 | 5.4 | 203 | 8.0 | 220 | 6.1 | 773 | 26.1 |
| 78. Road vehicles | 3 | 0.1 | 6 | 0.2 | 198 | 5.5 | 385 | 13.0 | ||
| 79. Other transport equipment | 55 | 1.0 | 111 | 4.4 | ||||||
| 8. Miscellaneous manufactured articles | 354 | 8.7 | 116 | 2.0 | 137 | 5.4 | 550 | 15.2 | 245 | 8.3 |
| 81. Prefabr.buildings;sanitary,lighting etc.fixtrs | 173 | 4.3 | 39 | 1.6 | 342 | 9.4 | 150 | 5.1 | ||
| 82. Furniture and parts thereof | 1 | 0.0 | 1 | 0.0 | 5 | 0.2 | ||||
| 83. Travel goods,handbags and sim.containers | 1 | 0.0 | 1 | 0.0 | 1 | 0.0 | 1 | 0.0 | ||
| 84. Articles of apparel and clothing accessories | 29 | 0.7 | 18 | 0.3 | 25 | 1.0 | 28 | 0.8 | 35 | 1.2 |
| 85. Footwear | 11 | 0.3 | 8 | 0.1 | 14 | 0.5 | 3 | 0.1 | 2 | 0.1 |
| 87. Instruments and apparates n.e.s. | 12 | 0.3 | 16 | 0.3 | 32 | 1.3 | 38 | 1.1 | 20 | 0.7 |
| 88. Photographic equipment,optical goods etc. | 1 | 0.0 | ||||||||
| 89. Miscellaneous manufactured articles,n.e.s. | 127 | 3.1 | 73 | 1.3 | 26 | 1.0 | 139 | 3.8 | 33 | 1.1 |
| All groups combined | 4,074 | 100.0 | 5,659 | 100.0 | 2,525 | 100.0 | 3,624 | 100.0 | 2,965 | 100.0 |
| 2021 | 2022 | 2023 | 2024 | 2025 | ||||||
|---|---|---|---|---|---|---|---|---|---|---|
| 1,000 € | % | 1,000 € | % | 1,000 € | % | 1,000 € | % | 1,000 € | % | |
| 0. Food and live animals | 96 | 3.2 | 93 | 93.3 | 116 | 91.3 | 50 | 93.9 | 65 | 93.0 |
| 03. Fish and fish preparations | 96 | 3.2 | 93 | 93.3 | 116 | 91.3 | 50 | 93.9 | 65 | 93.0 |
| 5. Chemicals and related products,n.e.s. | 3 | 2.8 | ||||||||
| 58. Plastics in non-primary forms | 3 | 2.8 | ||||||||
| 6. Basic manufactures | 2 | 0.1 | ||||||||
| 69. Manufactures of metals,n.e.s. | 2 | 0.1 | ||||||||
| 7. Machinery,transport equipment | 2,850 | 96.7 | 1 | 0.7 | 8 | 6.0 | 1 | 1.1 | 2 | 3.5 |
| 71. Power generating machinery and equipment | 2 | 1.6 | ||||||||
| 74. General industrial machinery n.e.s. | 5 | 4.2 | 2 | 3.0 | ||||||
| 77. Electric machinery,n.e.s.and parts | 1 | 0.7 | ||||||||
| 79. Other transport equipment | 2,850 | 96.7 | ||||||||
| 8. Miscellaneous manufactured articles | 1 | 1.1 | 1 | 0.5 | 1 | 1.8 | 1 | 1.6 | ||
| 89. Miscellaneous manufactured articles,n.e.s. | 1 | 1.1 | 1 | 0.5 | 1 | 1.8 | 1 | 1.6 | ||
| 9. Goods not classified elsewhere | 1 | 0.0 | 2 | 2.0 | 3 | 2.0 | 1 | 2.5 | 1 | 1.6 |
| 93. Special transactions and commodities not classified | 1 | 0.0 | 2 | 2.0 | 3 | 2.0 | 1 | 2.5 | 1 | 1.6 |
| All groups combined | 2,948 | 100.0 | 99 | 100.0 | 127 | 100.0 | 54 | 100.0 | 69 | 100.0 |
| Classification | Description | Year level | Quarter level | Month level | |
|---|---|---|---|---|---|
| SITC | Standard International Trade Classification (classification system is maintained by the United Nations) | ||||
| BEC | The standard of statistical classification of BEC (Broad Economic Categories) is upheld by the UN and it is based on SITC-nomenclature. | ||||
| NACE | National industrial classification based on Statistical Classification of Economic Activities in the European Community Nomenclature générale des Activités économiques dans les Communautés européennes | ||||
| CPA | CPA = Classification of Products by Activities | ||||
| CN | The Combined Nomenclature is the common nomenclature of the European Community. |