
| Export of goods from Finland and import to Finland | BEC (Broad Economic Categories) |
*) The standard of statistical classification of BEC (Broad Economic Categories) is upheld by the UN and it is based on SITC-nomenclature.
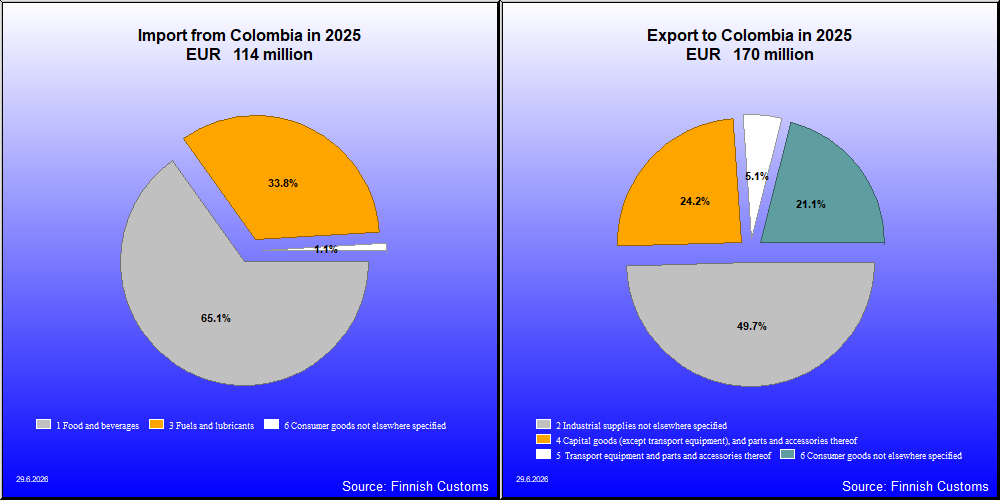

| 2021 | 2022 | 2023 | 2024 | 2025 | ||||||
|---|---|---|---|---|---|---|---|---|---|---|
| 1,000 € | % | 1,000 € | % | 1,000 € | % | 1,000 € | % | 1,000 € | % | |
| 1. Food and beverages | 70 | 0.1 | 113 | 0.1 | 141 | 0.1 | ||||
| 12. Food and beverages, processed | 70 | 0.1 | 113 | 0.1 | 141 | 0.1 | ||||
| 121. Food and beverages, processed, mainly for industry | 7 | 0.0 | ||||||||
| 122. Food and beverages, processed, mainly for household consumption | 63 | 0.1 | 113 | 0.1 | 141 | 0.1 | ||||
| 2. Industrial supplies not elsewhere specified | 73,908 | 61.8 | 94,281 | 71.4 | 73,925 | 64.4 | 69,272 | 56.4 | 84,618 | 49.7 |
| 21. Industrial supplies not elsewhere specified, primary | 4 | 0.0 | 2 | 0.0 | 207 | 0.2 | 120 | 0.1 | 2 | 0.0 |
| 22. Industrial supplies not elsewhere specified, processed | 73,904 | 61.8 | 94,279 | 71.4 | 73,718 | 64.3 | 69,152 | 56.3 | 84,617 | 49.7 |
| 3. Fuels and lubricants | 6 | 0.0 | 17 | 0.0 | 10 | 0.0 | 7 | 0.0 | 8 | 0.0 |
| 31. Fuels and lubricants, primary | 13 | 0.0 | ||||||||
| 32. Fuels and lubricants, processed | 6 | 0.0 | 4 | 0.0 | 10 | 0.0 | 7 | 0.0 | 8 | 0.0 |
| 322. Fuels and lubricants, other | 6 | 0.0 | 4 | 0.0 | 10 | 0.0 | 7 | 0.0 | 8 | 0.0 |
| 4. Capital goods (except transport equipment), and parts and accessories thereof | 39,243 | 32.8 | 32,015 | 24.2 | 20,691 | 18.0 | 27,892 | 22.7 | 41,136 | 24.1 |
| 41. Capital goods (except transport equipment) | 8,209 | 6.9 | 14,172 | 10.7 | 13,328 | 11.6 | 14,041 | 11.4 | 29,217 | 17.2 |
| 42. Capital goods (except transport equipment), parts and accessories | 31,034 | 26.0 | 17,844 | 13.5 | 7,363 | 6.4 | 13,852 | 11.3 | 11,919 | 7.0 |
| 5. Transport equipment and parts and accessories thereof | 88 | 0.1 | 60 | 0.0 | 1,691 | 1.5 | 1,003 | 0.8 | 8,609 | 5.1 |
| 52. Transport equipment, other than passenger motor vehicles | 43 | 0.0 | 5 | 0.0 | 1,557 | 1.4 | 953 | 0.8 | 1,462 | 0.9 |
| 521. Transport equipment, other than passenger motor vehicles, industrial | 43 | 0.0 | 5 | 0.0 | 1,557 | 1.4 | 943 | 0.8 | 1,462 | 0.9 |
| 522. Transport equipment, other than passenger motor vehicles, non-industrial | 10 | 0.0 | ||||||||
| 53. Transport equipment, parts and accessories | 45 | 0.0 | 55 | 0.0 | 134 | 0.1 | 50 | 0.0 | 7,147 | 4.2 |
| 6. Consumer goods not elsewhere specified | 6,268 | 5.2 | 4,653 | 3.5 | 6,760 | 5.9 | 14,504 | 11.8 | 35,964 | 21.1 |
| 61. Consumer goods not elsewhere specified, durable | 38 | 0.0 | 118 | 0.1 | 99 | 0.1 | 248 | 0.2 | 318 | 0.2 |
| 62. Consumer goods not elsewhere specified, semi-durable | 135 | 0.1 | 98 | 0.1 | 92 | 0.1 | 218 | 0.2 | 207 | 0.1 |
| 63. Consumer goods not elsewhere specified, non-durable | 6,096 | 5.1 | 4,437 | 3.4 | 6,569 | 5.7 | 14,039 | 11.4 | 35,439 | 20.8 |
| 7. Goods not elsewhere specified | 943 | 0.7 | 11,636 | 10.1 | 9,938 | 8.1 | ||||
| All groups | 119,582 | 100.0 | 132,082 | 100.0 | 114,712 | 100.0 | 122,756 | 100.0 | 170,336 | 100.0 |
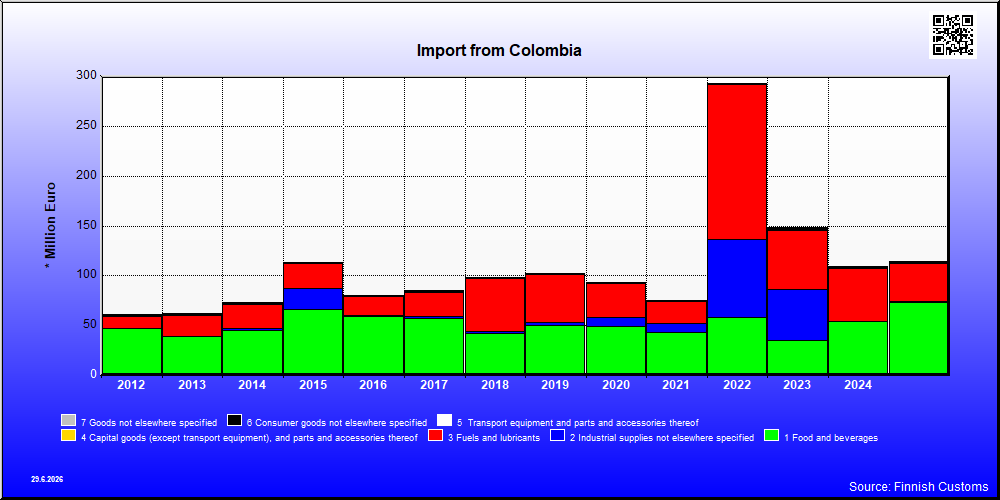
| 2021 | 2022 | 2023 | 2024 | 2025 | ||||||
|---|---|---|---|---|---|---|---|---|---|---|
| 1,000 € | % | 1,000 € | % | 1,000 € | % | 1,000 € | % | 1,000 € | % | |
| 1. Food and beverages | 43,515 | 58.0 | 58,117 | 19.8 | 34,675 | 23.3 | 53,692 | 49.0 | 73,687 | 64.6 |
| 11. Food and beverages, primary | 42,875 | 57.1 | 56,990 | 19.4 | 33,849 | 22.7 | 52,802 | 48.2 | 72,897 | 64.0 |
| 111. Food and beverages, primary, mainly for industry | 40,596 | 54.1 | 55,813 | 19.0 | 32,644 | 21.9 | 49,729 | 45.4 | 56,416 | 49.5 |
| 112. Food and beverages, primary, mainly for household consumption | 2,280 | 3.0 | 1,177 | 0.4 | 1,206 | 0.8 | 3,072 | 2.8 | 16,481 | 14.5 |
| 12. Food and beverages, processed | 639 | 0.9 | 1,127 | 0.4 | 826 | 0.6 | 890 | 0.8 | 789 | 0.7 |
| 121. Food and beverages, processed, mainly for industry | 1 | 0.0 | ||||||||
| 122. Food and beverages, processed, mainly for household consumption | 639 | 0.9 | 1,127 | 0.4 | 826 | 0.6 | 890 | 0.8 | 789 | 0.7 |
| 2. Industrial supplies not elsewhere specified | 8,640 | 11.5 | 78,002 | 26.6 | 51,349 | 34.5 | 512 | 0.5 | 285 | 0.3 |
| 21. Industrial supplies not elsewhere specified, primary | 3 | 0.0 | 344 | 0.1 | 29 | 0.0 | 1 | 0.0 | 1 | 0.0 |
| 22. Industrial supplies not elsewhere specified, processed | 8,636 | 11.5 | 77,659 | 26.5 | 51,320 | 34.5 | 511 | 0.5 | 285 | 0.2 |
| 3. Fuels and lubricants | 22,404 | 29.8 | 155,713 | 53.1 | 59,657 | 40.1 | 53,142 | 48.5 | 38,289 | 33.6 |
| 31. Fuels and lubricants, primary | 91,931 | 31.4 | 3,794 | 2.5 | ||||||
| 32. Fuels and lubricants, processed | 22,404 | 29.8 | 63,782 | 21.8 | 55,863 | 37.5 | 53,142 | 48.5 | 38,289 | 33.6 |
| 322. Fuels and lubricants, other | 22,404 | 29.8 | 63,782 | 21.8 | 55,863 | 37.5 | 53,142 | 48.5 | 38,289 | 33.6 |
| 4. Capital goods (except transport equipment), and parts and accessories thereof | 135 | 0.2 | 136 | 0.0 | 269 | 0.2 | 175 | 0.2 | 195 | 0.2 |
| 41. Capital goods (except transport equipment) | 28 | 0.0 | 90 | 0.0 | 260 | 0.2 | 152 | 0.1 | 127 | 0.1 |
| 42. Capital goods (except transport equipment), parts and accessories | 107 | 0.1 | 47 | 0.0 | 9 | 0.0 | 23 | 0.0 | 68 | 0.1 |
| 5. Transport equipment and parts and accessories thereof | 11 | 0.0 | 9 | 0.0 | 15 | 0.0 | 56 | 0.1 | 89 | 0.1 |
| 53. Transport equipment, parts and accessories | 11 | 0.0 | 9 | 0.0 | 15 | 0.0 | 56 | 0.1 | 89 | 0.1 |
| 6. Consumer goods not elsewhere specified | 335 | 0.4 | 1,166 | 0.4 | 1,570 | 1.1 | 1,421 | 1.3 | 1,196 | 1.0 |
| 61. Consumer goods not elsewhere specified, durable | 1 | 0.0 | 1 | 0.0 | 3 | 0.0 | 7 | 0.0 | 1 | 0.0 |
| 62. Consumer goods not elsewhere specified, semi-durable | 126 | 0.2 | 147 | 0.1 | 89 | 0.1 | 62 | 0.1 | 47 | 0.0 |
| 63. Consumer goods not elsewhere specified, non-durable | 209 | 0.3 | 1,018 | 0.3 | 1,478 | 1.0 | 1,352 | 1.2 | 1,148 | 1.0 |
| 7. Goods not elsewhere specified | 29 | 0.0 | 64 | 0.0 | 1,263 | 0.8 | 566 | 0.5 | 244 | 0.2 |
| All groups | 75,069 | 100.0 | 293,206 | 100.0 | 148,798 | 100.0 | 109,563 | 100.0 | 113,985 | 100.0 |
| Classification | Description | Year level | Quarter level | Month level | |
|---|---|---|---|---|---|
| SITC | Standard International Trade Classification (classification system is maintained by the United Nations) | ███ | ███ | ███ | |
| BEC | The standard of statistical classification of BEC (Broad Economic Categories) is upheld by the UN and it is based on SITC-nomenclature. | ███ | ███ | ███ | |
| NACE | National industrial classification based on Statistical Classification of Economic Activities in the European Community Nomenclature générale des Activités économiques dans les Communautés européennes | ███ | ███ | ███ | |
| CPA | CPA = Classification of Products by Activities | ███ | ███ | ███ | |
| CN | The Combined Nomenclature is the common nomenclature of the European Community. | ███ | ███ | ███ |