
| Export of goods from Finland and import to Finland | Trade Balance |
The value of imports from Canada was 263.5 per cent higher than in August of the previous year, thus amounting now to €103 million. Major product categories of imports from Canada were Sitc 283 (copper ores and concentrates; copper mattes; cement copper), representing 43.3 per cent of imports, Sitc 284 (nickel ores and concentrates; nickel mattes, nickel oxide sinters and other intermediate products of nickel metallurgy) 30.8 % and Sitc 542 (medicaments (including veterinary medicaments)) 4.9 % of the imports.
The value of exports to Canada were 17.2 percent higher than in August of the previous year, thus amounting to €73 million. The largest product groups of exports were: Sitc 723 (civil engineering and contractors' plant and equipment; parts thereof), which represented a share of 17.7 per cent of total exports, Sitc 711 (steam or other vapour-generating boilers, superheated water boilers, and auxiliary plant for use therewith; parts thereof) 13.6 % and Sitc 625 (rubber tyres, interchangeable tyre treads, tyre flaps and inner tubes for wheels of all kinds) 8.0 % of the exports.
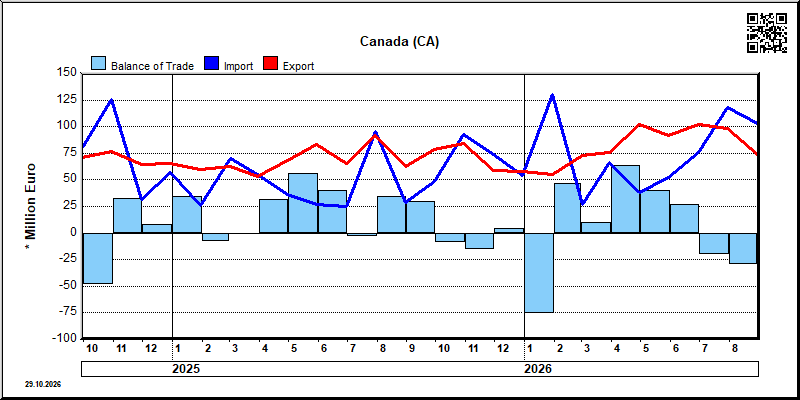
| Year | Month | Import 1,000 € | Export 1,000 € | Trade 1,000 € | Trade Balance 1,000 € |
|---|---|---|---|---|---|
| 2023 | 1 | 27,632 | 103,815 | 131,448 | 76,183 |
| 2023 | 2 | 28,076 | 76,486 | 104,562 | 48,410 |
| 2023 | 3 | 41,805 | 80,713 | 122,518 | 38,908 |
| 2023 | 4 | 40,439 | 73,775 | 114,214 | 33,336 |
| 2023 | 5 | 26,351 | 216,922 | 243,274 | 190,571 |
| 2023 | 6 | 49,938 | 131,959 | 181,897 | 82,021 |
| 2023 | 7 | 109,193 | 103,220 | 212,413 | -5,973 |
| 2023 | 8 | 33,498 | 64,393 | 97,891 | 30,894 |
| 2023 | 9 | 15,654 | 63,989 | 79,643 | 48,335 |
| 2023 | 10 | 31,744 | 75,223 | 106,967 | 43,479 |
| 2023 | 11 | 61,289 | 57,401 | 118,690 | -3,889 |
| 2023 | 12 | 36,607 | 52,671 | 89,278 | 16,064 |
| 2024 | 1 | 44,922 | 81,889 | 126,811 | 36,968 |
| 2024 | 2 | 93,516 | 63,052 | 156,568 | -30,464 |
| 2024 | 3 | 14,661 | 47,940 | 62,601 | 33,279 |
| 2024 | 4 | 72,526 | 103,279 | 175,805 | 30,753 |
| 2024 | 5 | 28,122 | 100,497 | 128,619 | 72,376 |
| 2024 | 6 | 28,564 | 77,608 | 106,171 | 49,044 |
| 2024 | 7 | 95,060 | 82,130 | 177,190 | -12,930 |
| 2024 | 8 | 53,244 | 72,820 | 126,064 | 19,576 |
| 2024 | 9 | 80,109 | 71,014 | 151,123 | -9,095 |
| 2024 | 10 | 125,148 | 76,732 | 201,880 | -48,415 |
| 2024 | 11 | 31,718 | 64,144 | 95,862 | 32,427 |
| 2024 | 12 | 57,249 | 65,417 | 122,666 | 8,168 |
| 2025 | 1 | 25,544 | 60,230 | 85,774 | 34,686 |
| 2025 | 2 | 70,190 | 62,291 | 132,481 | -7,898 |
| 2025 | 3 | 54,720 | 53,415 | 108,135 | -1,305 |
| 2025 | 4 | 36,219 | 67,763 | 103,983 | 31,544 |
| 2025 | 5 | 26,708 | 83,130 | 109,838 | 56,422 |
| 2025 | 6 | 25,294 | 65,776 | 91,070 | 40,482 |
| 2025 | 7 | 95,260 | 92,102 | 187,361 | -3,158 |
| 2025 | 8 | 28,295 | 62,666 | 90,961 | 34,371 |
| 2025 | 9 | 48,917 | 79,012 | 127,929 | 30,095 |
| 2025 | 10 | 92,481 | 83,817 | 176,298 | -8,663 |
| 2025 | 11 | 74,125 | 59,078 | 133,203 | -15,047 |
| 2025 | 12 | 54,210 | 58,346 | 112,555 | 4,136 |
| 2026 | 1 | 130,708 | 54,759 | 185,467 | -75,949 |
| 2026 | 2 | 26,606 | 72,783 | 99,389 | 46,177 |
| 2026 | 3 | 66,270 | 75,858 | 142,128 | 9,587 |
| 2026 | 4 | 37,840 | 101,674 | 139,514 | 63,834 |
| 2026 | 5 | 52,104 | 92,018 | 144,122 | 39,914 |
| 2026 | 6 | 75,469 | 102,095 | 177,564 | 26,626 |
| 2026 | 7 | 118,297 | 97,991 | 216,287 | -20,306 |
| 2026 | 8 | 102,847 | 73,420 | 176,267 | -29,428 |

| 2026/4 | 2026/5 | 2026/6 | 2026/7 | 2026/8 | ||||||
|---|---|---|---|---|---|---|---|---|---|---|
| 1000 € | % | 1000 € | % | 1000 € | % | 1000 € | % | 1000 € | % | |
| 0. Food and live animals | 260 | 0.3 | 203 | 0.2 | 40 | 0.0 | 87 | 0.1 | 240 | 0.3 |
| 1. Beverages and tobacco | 261 | 0.3 | 156 | 0.2 | 307 | 0.3 | 237 | 0.2 | 139 | 0.2 |
| 2. Crude materials,inedible,except fuels | 6,490 | 6.4 | 12,443 | 13.5 | 6,933 | 6.8 | 9,690 | 9.9 | 398 | 0.5 |
| 3. Mineral fuels etc | 32 | 0.0 | 18 | 0.0 | 25 | 0.0 | 7 | 0.0 | 12 | 0.0 |
| 5. Chemicals and related products,n.e.s. | 8,764 | 8.6 | 7,488 | 8.1 | 4,280 | 4.2 | 6,326 | 6.5 | 2,649 | 3.6 |
| 6. Basic manufactures | 22,171 | 21.8 | 19,910 | 21.6 | 23,373 | 22.9 | 12,408 | 12.7 | 13,967 | 19.0 |
| 7. Machinery,transport equipment | 52,389 | 51.5 | 44,075 | 47.9 | 55,803 | 54.7 | 55,166 | 56.3 | 49,726 | 67.7 |
| 8. Miscellaneous manufactured articles | 11,307 | 11.1 | 7,722 | 8.4 | 11,335 | 11.1 | 14,070 | 14.4 | 6,288 | 8.6 |
| 9. Goods not classified elsewhere | 4 | 0.0 | ||||||||
| All groups combined | 101,674 | 100.0 | 92,018 | 100.0 | 102,095 | 100.0 | 97,991 | 100.0 | 73,420 | 100.0 |

| 2026/4 | 2026/5 | 2026/6 | 2026/7 | 2026/8 | ||||||
|---|---|---|---|---|---|---|---|---|---|---|
| 1000 € | % | 1000 € | % | 1000 € | % | 1000 € | % | 1000 € | % | |
| 0. Food and live animals | 1,975 | 5.2 | 571 | 1.1 | 1,122 | 1.5 | 633 | 0.5 | 577 | 0.6 |
| 1. Beverages and tobacco | 148 | 0.4 | 89 | 0.2 | 281 | 0.4 | 269 | 0.2 | 119 | 0.1 |
| 2. Crude materials,inedible,except fuels | 8,257 | 21.8 | 2,173 | 4.2 | 2,229 | 3.0 | 73,921 | 62.5 | 78,003 | 75.8 |
| 3. Mineral fuels etc | 244 | 0.6 | 24,898 | 47.8 | 53,068 | 70.3 | 15,848 | 13.4 | 351 | 0.3 |
| 4. Animal and vegetable oils and fats | 15 | 0.0 | 11 | 0.0 | 10 | 0.0 | 30 | 0.0 | ||
| 5. Chemicals and related products,n.e.s. | 10,933 | 28.9 | 10,670 | 20.5 | 9,392 | 12.4 | 13,533 | 11.4 | 9,504 | 9.2 |
| 6. Basic manufactures | 4,132 | 10.9 | 2,832 | 5.4 | 1,879 | 2.5 | 3,307 | 2.8 | 2,463 | 2.4 |
| 7. Machinery,transport equipment | 10,135 | 26.8 | 8,272 | 15.9 | 4,682 | 6.2 | 7,718 | 6.5 | 7,546 | 7.3 |
| 8. Miscellaneous manufactured articles | 1,914 | 5.1 | 2,518 | 4.8 | 2,706 | 3.6 | 2,942 | 2.5 | 4,199 | 4.1 |
| 9. Goods not classified elsewhere | 87 | 0.2 | 68 | 0.1 | 100 | 0.1 | 96 | 0.1 | 86 | 0.1 |
| All groups combined | 37,840 | 100.0 | 52,104 | 100.0 | 75,469 | 100.0 | 118,297 | 100.0 | 102,847 | 100.0 |
| Classification | Description | Year level | Quarter level | Month level | Year 2026 sofar |
|---|---|---|---|---|---|
| SITC | Standard International Trade Classification (classification system is maintained by the United Nations) | ███ | ███ | ███ | ███ |
| BEC | The standard of statistical classification of BEC (Broad Economic Categories) is upheld by the UN and it is based on SITC-nomenclature. | ███ | ███ | ███ | ███ |
| NACE | National industrial classification based on Statistical Classification of Economic Activities in the European Community Nomenclature générale des Activités économiques dans les Communautés européennes | ███ | ███ | ███ | ███ |
| CPA | CPA = Classification of Products by Activities | ███ | ███ | ███ | ███ |
| CN | The Combined Nomenclature is the common nomenclature of the European Community. | ███ | ███ | ███ | ███ |