
| Export of goods from Finland and import to Finland | BEC (Broad Economic Categories) |
*) The standard of statistical classification of BEC (Broad Economic Categories) is upheld by the UN and it is based on SITC-nomenclature.

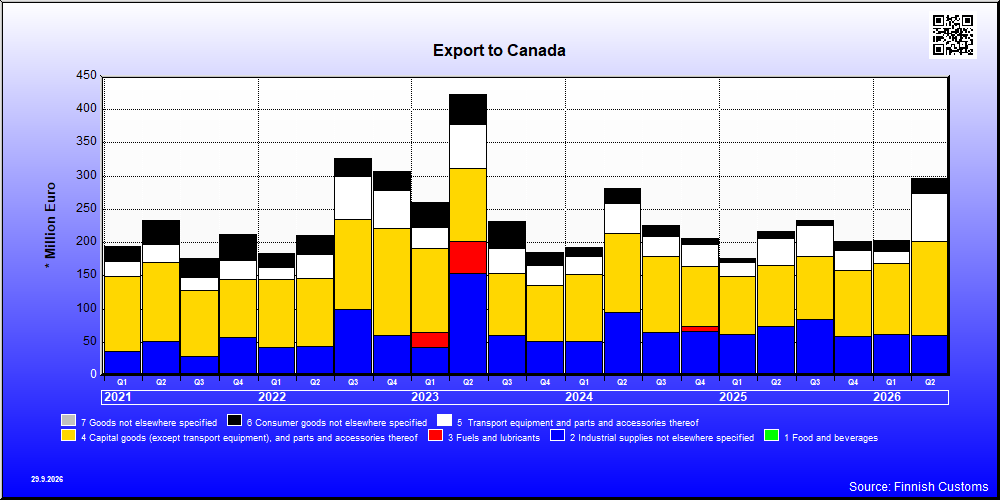
| Q2 / 2026 | Q2 / 2025 | Muutos edellisestä vastaavasta kaudesta % | ||
|---|---|---|---|---|
| 1,000 € | % | 1,000 € | ||
| 1. Food and beverages | 1,226 | 0.4 | 1,197 | 2.4 |
| 11. Food and beverages, primary | 35 | 0.0 | 3 | .. |
| 111. Food and beverages, primary, mainly for industry | 1 | 0.0 | 1 | -22.0 |
| 112. Food and beverages, primary, mainly for household consumption | 34 | 0.0 | 2 | .. |
| 12. Food and beverages, processed | 1,192 | 0.4 | 1,194 | -0.2 |
| 121. Food and beverages, processed, mainly for industry | 0 | 0.0 | 2 | -97.2 |
| 122. Food and beverages, processed, mainly for household consumption | 1,192 | 0.4 | 1,192 | -0.1 |
| 2. Industrial supplies not elsewhere specified | 59,449 | 20.0 | 72,779 | -18.3 |
| 21. Industrial supplies not elsewhere specified, primary | 294 | 0.1 | 23,777 | -98.8 |
| 22. Industrial supplies not elsewhere specified, processed | 59,155 | 19.9 | 49,002 | 20.7 |
| 3. Fuels and lubricants | 82 | 0.0 | 42 | 93.3 |
| 31. Fuels and lubricants, primary | 71 | 0.0 | 37 | 91.4 |
| 32. Fuels and lubricants, processed | 10 | 0.0 | 5 | 108.0 |
| 322. Fuels and lubricants, other | 10 | 0.0 | 5 | 108.0 |
| 4. Capital goods (except transport equipment), and parts and accessories thereof | 141,862 | 47.6 | 90,908 | 56.0 |
| 41. Capital goods (except transport equipment) | 111,205 | 37.3 | 73,593 | 51.1 |
| 42. Capital goods (except transport equipment), parts and accessories | 30,657 | 10.3 | 17,315 | 77.1 |
| 5. Transport equipment and parts and accessories thereof | 73,819 | 24.8 | 41,791 | 76.6 |
| 51. Passenger motor vehicles | 19 | 0.0 | 60 | -67.7 |
| 52. Transport equipment, other than passenger motor vehicles | 29,027 | 9.7 | 7,419 | 291.3 |
| 521. Transport equipment, other than passenger motor vehicles, industrial | 24,662 | 8.3 | 7,408 | 232.9 |
| 522. Transport equipment, other than passenger motor vehicles, non-industrial | 4,365 | 1.5 | 10 | .. |
| 53. Transport equipment, parts and accessories | 44,773 | 15.0 | 34,313 | 30.5 |
| 6. Consumer goods not elsewhere specified | 19,772 | 6.6 | 9,486 | 108.4 |
| 61. Consumer goods not elsewhere specified, durable | 4,073 | 1.4 | 4,311 | -5.5 |
| 62. Consumer goods not elsewhere specified, semi-durable | 3,278 | 1.1 | 1,955 | 67.7 |
| 63. Consumer goods not elsewhere specified, non-durable | 12,421 | 4.2 | 3,220 | 285.8 |
| 7. Goods not elsewhere specified | 1,691 | 0.6 | 466 | 262.5 |
| All groups | 297,901 | 100.0 | 216,670 | 37.5 |
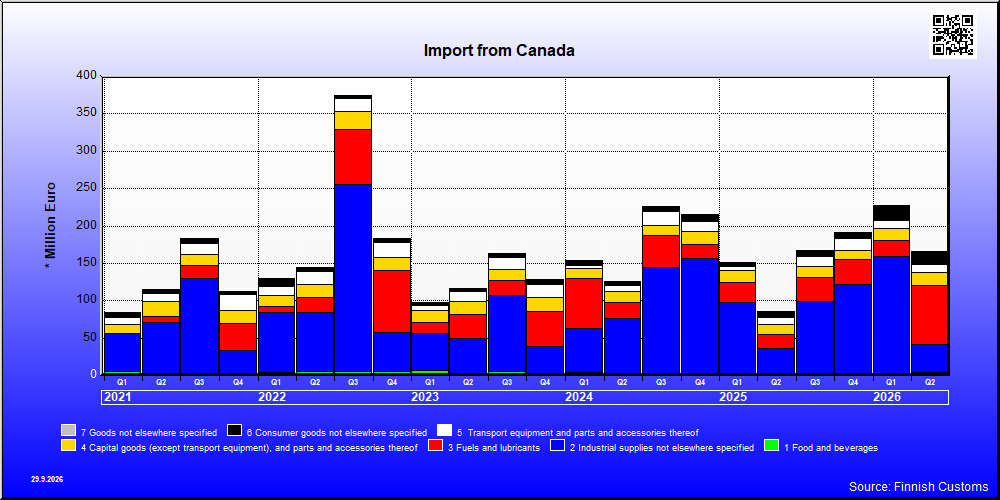
| Q2 / 2026 | Q2 / 2025 | Muutos edellisestä vastaavasta kaudesta % | ||
|---|---|---|---|---|
| 1,000 € | % | 1,000 € | ||
| 1. Food and beverages | 4,408 | 2.6 | 2,220 | 98.5 |
| 11. Food and beverages, primary | 2,025 | 1.2 | 497 | 307.9 |
| 111. Food and beverages, primary, mainly for industry | 1,540 | 0.9 | 282 | 446.0 |
| 112. Food and beverages, primary, mainly for household consumption | 485 | 0.3 | 215 | 126.2 |
| 12. Food and beverages, processed | 2,383 | 1.4 | 1,724 | 38.2 |
| 121. Food and beverages, processed, mainly for industry | 644 | 0.4 | 88 | 635.4 |
| 122. Food and beverages, processed, mainly for household consumption | 1,739 | 1.0 | 1,636 | 6.3 |
| 2. Industrial supplies not elsewhere specified | 38,915 | 23.3 | 33,829 | 15.0 |
| 21. Industrial supplies not elsewhere specified, primary | 11,884 | 7.1 | 1,240 | 858.4 |
| 22. Industrial supplies not elsewhere specified, processed | 27,031 | 16.2 | 32,589 | -17.1 |
| 3. Fuels and lubricants | 78,750 | 47.1 | 18,549 | 324.6 |
| 31. Fuels and lubricants, primary | 67,430 | 40.3 | 2,794 | .. |
| 32. Fuels and lubricants, processed | 11,321 | 6.8 | 15,755 | -28.1 |
| 322. Fuels and lubricants, other | 11,321 | 6.8 | 15,755 | -28.1 |
| 4. Capital goods (except transport equipment), and parts and accessories thereof | 17,058 | 10.2 | 13,225 | 29.0 |
| 41. Capital goods (except transport equipment) | 11,031 | 6.6 | 8,145 | 35.4 |
| 42. Capital goods (except transport equipment), parts and accessories | 6,027 | 3.6 | 5,080 | 18.6 |
| 5. Transport equipment and parts and accessories thereof | 10,793 | 6.4 | 9,737 | 10.8 |
| 51. Passenger motor vehicles | 68 | 0.0 | 56 | 21.3 |
| 52. Transport equipment, other than passenger motor vehicles | 69 | 0.0 | 114 | -39.2 |
| 521. Transport equipment, other than passenger motor vehicles, industrial | 0 | 0 | 5 | .. |
| 522. Transport equipment, other than passenger motor vehicles, non-industrial | 69 | 0.0 | 109 | -36.6 |
| 53. Transport equipment, parts and accessories | 10,657 | 6.4 | 9,568 | 11.4 |
| 6. Consumer goods not elsewhere specified | 16,911 | 10.1 | 7,349 | 130.1 |
| 61. Consumer goods not elsewhere specified, durable | 323 | 0.2 | 162 | 99.6 |
| 62. Consumer goods not elsewhere specified, semi-durable | 1,020 | 0.6 | 1,748 | -41.7 |
| 63. Consumer goods not elsewhere specified, non-durable | 15,569 | 9.3 | 5,439 | 186.2 |
| 7. Goods not elsewhere specified | 522 | 0.3 | 393 | 32.8 |
| All groups | 167,358 | 100.0 | 85,302 | 96.2 |
| Classification | Description | Year level | Quarter level | Month level | Year 2026 sofar |
|---|---|---|---|---|---|
| SITC | Standard International Trade Classification (classification system is maintained by the United Nations) | ███ | ███ | ███ | ███ |
| BEC | The standard of statistical classification of BEC (Broad Economic Categories) is upheld by the UN and it is based on SITC-nomenclature. | ███ | ███ | ███ | ███ |
| NACE | National industrial classification based on Statistical Classification of Economic Activities in the European Community Nomenclature générale des Activités économiques dans les Communautés européennes | ███ | ███ | ███ | ███ |
| CPA | CPA = Classification of Products by Activities | ███ | ███ | ███ | ███ |
| CN | The Combined Nomenclature is the common nomenclature of the European Community. | ███ | ███ | ███ | ███ |