
| Export of goods from Finland and import to Finland | Trade Balance |

| Import 1,000 € | Export 1,000 € | Trade 1,000 € | Trade Balance 1,000 € | |
|---|---|---|---|---|
| 2019 Q1 | 124,410 | 90,976 | 215,386 | -33,434 |
| 2019 Q2 | 124,761 | 89,735 | 214,496 | -35,026 |
| 2019 Q3 | 111,972 | 89,151 | 201,123 | -22,820 |
| 2019 Q4 | 112,575 | 92,056 | 204,631 | -20,519 |
| 2020 Q1 | 127,228 | 104,761 | 231,990 | -22,467 |
| 2020 Q2 | 83,860 | 133,149 | 217,009 | 49,290 |
| 2020 Q3 | 89,686 | 164,619 | 254,305 | 74,933 |
| 2020 Q4 | 88,803 | 165,082 | 253,885 | 76,280 |
| 2021 Q1 | 103,383 | 108,529 | 211,911 | 5,146 |
| 2021 Q2 | 130,987 | 125,831 | 256,819 | -5,156 |
| 2021 Q3 | 84,927 | 98,948 | 183,875 | 14,020 |
| 2021 Q4 | 131,779 | 176,670 | 308,449 | 44,891 |
| 2022 Q1 | 159,128 | 171,579 | 330,706 | 12,451 |
| 2022 Q2 | 245,835 | 206,832 | 452,668 | -39,003 |
| 2022 Q3 | 176,388 | 223,817 | 400,206 | 47,429 |
| 2022 Q4 | 251,482 | 238,926 | 490,407 | -12,556 |
| 2023 Q1 | 170,240 | 210,100 | 380,340 | 39,860 |
| 2023 Q2 | 158,134 | 204,367 | 362,501 | 46,233 |
| 2023 Q3 | 201,840 | 106,435 | 308,275 | -95,405 |
| 2023 Q4 | 228,119 | 147,207 | 375,326 | -80,913 |
| 2024 Q1 | 151,191 | 117,425 | 268,616 | -33,765 |
| 2024 Q2 | 174,105 | 134,499 | 308,604 | -39,605 |
| 2024 Q3 | 218,196 | 117,459 | 335,655 | -100,737 |
| 2024 Q4 | 154,380 | 135,911 | 290,291 | -18,469 |
| 2025 Q1 | 225,120 | 115,314 | 340,434 | -109,807 |
| 2025 Q2 | 156,399 | 115,592 | 271,991 | -40,807 |
| 2025 Q3 | 166,463 | 109,887 | 276,350 | -56,575 |
| 2025 Q4 | 315,060 | 166,487 | 481,547 | -148,573 |
| 2026 Q1 | 266,523 | 182,147 | 448,669 | -84,376 |
| 2026 Q2 | 214,366 | 182,714 | 397,080 | -31,652 |

| Q2 / 2026 | Q2 / 2025 | Muutos edellisestä vastaavasta kaudesta % | ||
|---|---|---|---|---|
| 1,000 € | % | 1,000 € | ||
| 0. Food and live animals | 0 | 0.0 | 83 | -99.8 |
| 1. Beverages and tobacco | 0 | 0 | 0 | .. |
| 2. Crude materials,inedible,except fuels | 57 | 0.0 | 81 | -29.8 |
| 3. Mineral fuels etc | 9 | 0.0 | 3 | 159.3 |
| 5. Chemicals and related products,n.e.s. | 49,636 | 27.2 | 15,544 | 219.3 |
| 6. Basic manufactures | 16,602 | 9.1 | 16,769 | -1.0 |
| 7. Machinery,transport equipment | 95,793 | 52.4 | 68,818 | 39.2 |
| 8. Miscellaneous manufactured articles | 20,618 | 11.3 | 13,568 | 52.0 |
| All groups combined | 182,714 | 100.0 | 114,866 | 59.1 |
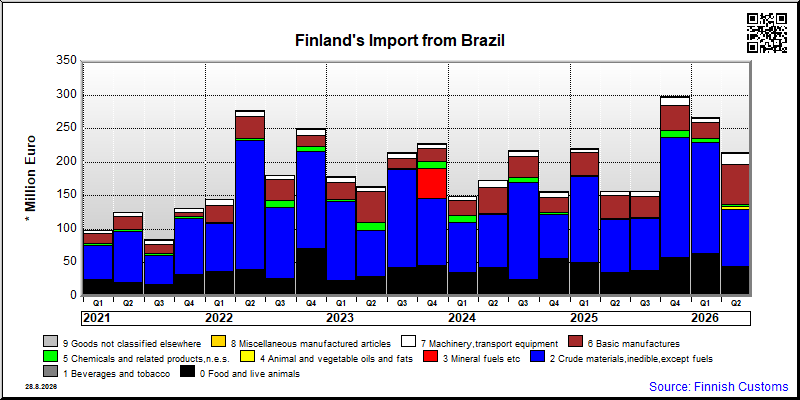
| Q2 / 2026 | Q2 / 2025 | Muutos edellisestä vastaavasta kaudesta % | ||
|---|---|---|---|---|
| 1,000 € | % | 1,000 € | ||
| 0. Food and live animals | 45,351 | 21.2 | 35,111 | 29.2 |
| 1. Beverages and tobacco | 6 | 0.0 | 4 | 50.4 |
| 2. Crude materials,inedible,except fuels | 84,473 | 39.4 | 79,289 | 6.5 |
| 3. Mineral fuels etc | 0 | 0.0 | 0 | .. |
| 4. Animal and vegetable oils and fats | 4,300 | 2.0 | 1 | .. |
| 5. Chemicals and related products,n.e.s. | 3,248 | 1.5 | 2,424 | 34.0 |
| 6. Basic manufactures | 58,903 | 27.5 | 33,355 | 76.6 |
| 7. Machinery,transport equipment | 16,955 | 7.9 | 5,491 | 208.8 |
| 8. Miscellaneous manufactured articles | 1,123 | 0.5 | 905 | 24.2 |
| 9. Goods not classified elsewhere | 6 | 0.0 | 9 | -25.5 |
| All groups combined | 214,366 | 100.0 | 156,587 | 36.9 |
| Classification | Description | Year level | Quarter level | Month level | Year 2026 sofar |
|---|---|---|---|---|---|
| SITC | Standard International Trade Classification (classification system is maintained by the United Nations) | ███ | ███ | ███ | ███ |
| BEC | The standard of statistical classification of BEC (Broad Economic Categories) is upheld by the UN and it is based on SITC-nomenclature. | ███ | ███ | ███ | ███ |
| NACE | National industrial classification based on Statistical Classification of Economic Activities in the European Community Nomenclature générale des Activités économiques dans les Communautés européennes | ███ | ███ | ███ | ███ |
| CPA | CPA = Classification of Products by Activities | ███ | ███ | ███ | ███ |
| CN | The Combined Nomenclature is the common nomenclature of the European Community. | ███ | ███ | ███ | ███ |