
| Export of goods from Finland and import to Finland | BEC (Broad Economic Categories) |
*) The standard of statistical classification of BEC (Broad Economic Categories) is upheld by the UN and it is based on SITC-nomenclature.

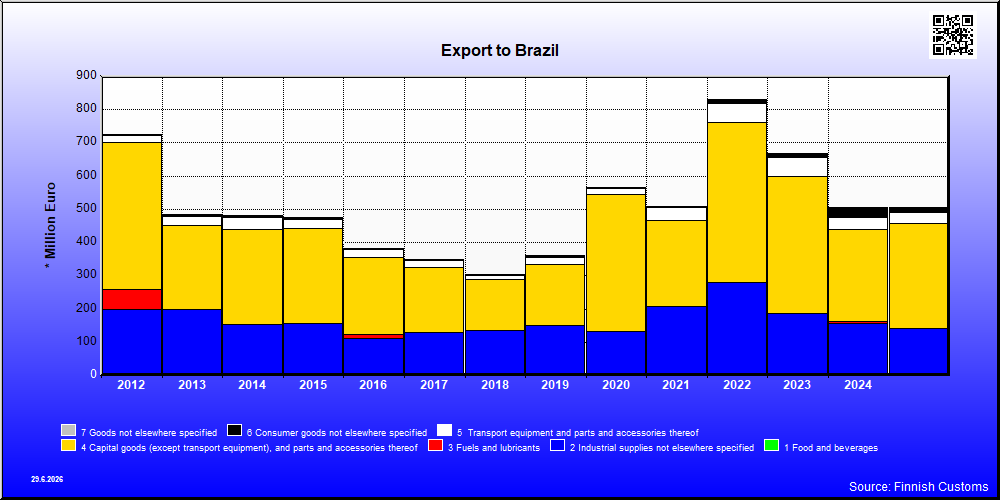
| 2021 | 2022 | 2023 | 2024 | 2025 | ||||||
|---|---|---|---|---|---|---|---|---|---|---|
| 1,000 € | % | 1,000 € | % | 1,000 € | % | 1,000 € | % | 1,000 € | % | |
| 1. Food and beverages | 1,566 | 0.3 | 479 | 0.1 | 2,253 | 0.3 | 370 | 0.1 | 343 | 0.1 |
| 11. Food and beverages, primary | 1 | 0.0 | 2 | 0.0 | ||||||
| 112. Food and beverages, primary, mainly for household consumption | 2 | 0.0 | ||||||||
| 12. Food and beverages, processed | 1,566 | 0.3 | 479 | 0.1 | 2,253 | 0.3 | 368 | 0.1 | 343 | 0.1 |
| 121. Food and beverages, processed, mainly for industry | 1,530 | 0.3 | 406 | 0.0 | 2,241 | 0.3 | 367 | 0.1 | 342 | 0.1 |
| 122. Food and beverages, processed, mainly for household consumption | 35 | 0.0 | 73 | 0.0 | 12 | 0.0 | 1 | 0.0 | 1 | 0.0 |
| 2. Industrial supplies not elsewhere specified | 206,715 | 40.5 | 280,098 | 33.7 | 184,877 | 27.6 | 156,771 | 31.1 | 142,553 | 28.2 |
| 21. Industrial supplies not elsewhere specified, primary | 189 | 0.0 | 96 | 0.0 | 168 | 0.0 | 196 | 0.0 | 164 | 0.0 |
| 22. Industrial supplies not elsewhere specified, processed | 206,526 | 40.5 | 280,002 | 33.6 | 184,709 | 27.6 | 156,575 | 31.0 | 142,389 | 28.1 |
| 3. Fuels and lubricants | 4 | 0.0 | 6 | 0.0 | 27 | 0.0 | 4,924 | 1.0 | 41 | 0.0 |
| 32. Fuels and lubricants, processed | 4 | 0.0 | 6 | 0.0 | 27 | 0.0 | 4,924 | 1.0 | 41 | 0.0 |
| 321. Fuels and lubricants, motor spirit | 3 | 0.0 | 4,889 | 1.0 | ||||||
| 322. Fuels and lubricants, other | 2 | 0.0 | 6 | 0.0 | 27 | 0.0 | 3,381 | 0.7 | 41 | 0.0 |
| 4. Capital goods (except transport equipment), and parts and accessories thereof | 258,241 | 50.6 | 479,512 | 57.6 | 411,217 | 61.5 | 277,269 | 54.9 | 315,725 | 62.4 |
| 41. Capital goods (except transport equipment) | 144,257 | 28.3 | 298,168 | 35.8 | 214,921 | 32.1 | 184,490 | 36.6 | 202,916 | 40.1 |
| 42. Capital goods (except transport equipment), parts and accessories | 113,984 | 22.4 | 181,344 | 21.8 | 196,296 | 29.3 | 92,779 | 18.4 | 112,810 | 22.3 |
| 5. Transport equipment and parts and accessories thereof | 37,752 | 7.4 | 60,017 | 7.2 | 57,071 | 8.5 | 37,183 | 7.4 | 30,923 | 6.1 |
| 51. Passenger motor vehicles | 360 | 0.1 | ||||||||
| 52. Transport equipment, other than passenger motor vehicles | 21,923 | 4.3 | 42,789 | 5.1 | 38,937 | 5.8 | 20,493 | 4.1 | 18,637 | 3.7 |
| 521. Transport equipment, other than passenger motor vehicles, industrial | 21,923 | 4.3 | 42,789 | 5.1 | 38,933 | 5.8 | 20,493 | 4.1 | 17,990 | 3.6 |
| 522. Transport equipment, other than passenger motor vehicles, non-industrial | 4 | 0.0 | 646 | 0.1 | ||||||
| 53. Transport equipment, parts and accessories | 15,828 | 3.1 | 17,228 | 2.1 | 17,774 | 2.7 | 16,690 | 3.3 | 12,286 | 2.4 |
| 6. Consumer goods not elsewhere specified | 4,873 | 1.0 | 12,056 | 1.4 | 13,490 | 2.0 | 27,931 | 5.5 | 16,694 | 3.3 |
| 61. Consumer goods not elsewhere specified, durable | 289 | 0.1 | 518 | 0.1 | 700 | 0.1 | 512 | 0.1 | 682 | 0.1 |
| 62. Consumer goods not elsewhere specified, semi-durable | 1,290 | 0.3 | 927 | 0.1 | 892 | 0.1 | 850 | 0.2 | 1,116 | 0.2 |
| 63. Consumer goods not elsewhere specified, non-durable | 3,294 | 0.6 | 10,611 | 1.3 | 11,898 | 1.8 | 26,569 | 5.3 | 14,897 | 2.9 |
| 7. Goods not elsewhere specified | 808 | 0.2 | 9 | 0.0 | 1 | 0.0 | 217 | 0.0 | 3 | 0.0 |
| All groups | 509,959 | 100.0 | 832,178 | 100.0 | 668,937 | 100.0 | 504,664 | 100.0 | 506,283 | 100.0 |
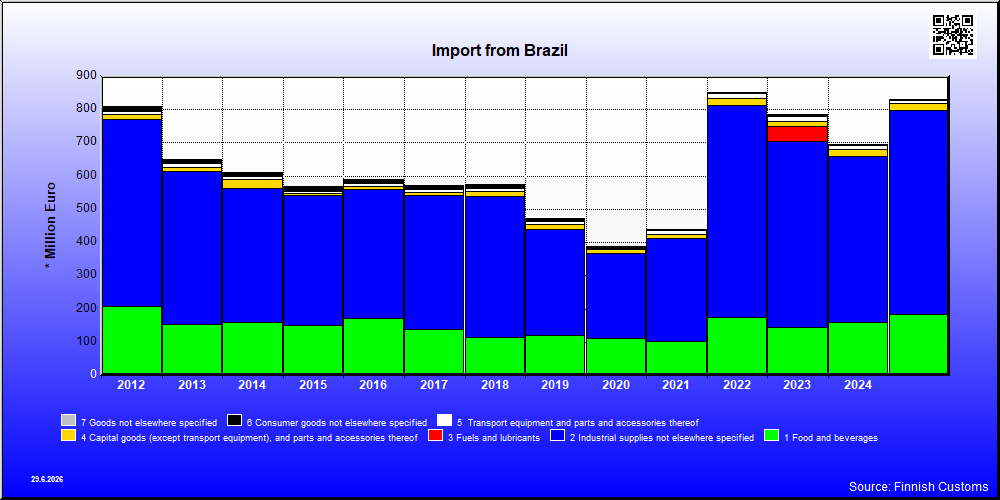
| 2021 | 2022 | 2023 | 2024 | 2025 | ||||||
|---|---|---|---|---|---|---|---|---|---|---|
| 1,000 € | % | 1,000 € | % | 1,000 € | % | 1,000 € | % | 1,000 € | % | |
| 1. Food and beverages | 102,433 | 23.3 | 174,474 | 20.4 | 144,212 | 18.4 | 160,038 | 23.0 | 182,210 | 21.9 |
| 11. Food and beverages, primary | 83,420 | 19.0 | 126,843 | 14.9 | 102,869 | 13.1 | 121,809 | 17.5 | 154,640 | 18.6 |
| 111. Food and beverages, primary, mainly for industry | 70,262 | 16.0 | 115,435 | 13.5 | 90,420 | 11.5 | 109,884 | 15.8 | 142,848 | 17.2 |
| 112. Food and beverages, primary, mainly for household consumption | 13,157 | 3.0 | 11,408 | 1.3 | 12,448 | 1.6 | 11,925 | 1.7 | 11,792 | 1.4 |
| 12. Food and beverages, processed | 19,013 | 4.3 | 47,631 | 5.6 | 41,343 | 5.3 | 38,230 | 5.5 | 27,570 | 3.3 |
| 121. Food and beverages, processed, mainly for industry | 1,974 | 0.4 | 25,293 | 3.0 | 18,058 | 2.3 | 8,253 | 1.2 | 686 | 0.1 |
| 122. Food and beverages, processed, mainly for household consumption | 17,039 | 3.9 | 22,338 | 2.6 | 23,285 | 3.0 | 29,976 | 4.3 | 26,883 | 3.2 |
| 2. Industrial supplies not elsewhere specified | 309,939 | 70.4 | 639,652 | 75.0 | 561,123 | 71.5 | 500,471 | 71.9 | 615,348 | 74.1 |
| 21. Industrial supplies not elsewhere specified, primary | 236,655 | 53.8 | 421,203 | 49.4 | 353,315 | 45.0 | 265,893 | 38.2 | 373,097 | 44.9 |
| 22. Industrial supplies not elsewhere specified, processed | 73,284 | 16.7 | 218,448 | 25.6 | 207,808 | 26.5 | 234,578 | 33.7 | 242,250 | 29.2 |
| 3. Fuels and lubricants | 44,591 | 5.7 | ||||||||
| 31. Fuels and lubricants, primary | 44,591 | 5.7 | ||||||||
| 4. Capital goods (except transport equipment), and parts and accessories thereof | 11,104 | 2.5 | 19,872 | 2.3 | 14,237 | 1.8 | 20,469 | 2.9 | 20,425 | 2.5 |
| 41. Capital goods (except transport equipment) | 6,930 | 1.6 | 14,143 | 1.7 | 7,571 | 1.0 | 11,549 | 1.7 | 14,452 | 1.7 |
| 42. Capital goods (except transport equipment), parts and accessories | 4,173 | 0.9 | 5,729 | 0.7 | 6,666 | 0.8 | 8,920 | 1.3 | 5,973 | 0.7 |
| 5. Transport equipment and parts and accessories thereof | 12,022 | 2.7 | 14,376 | 1.7 | 15,302 | 1.9 | 11,178 | 1.6 | 8,836 | 1.1 |
| 52. Transport equipment, other than passenger motor vehicles | 24 | 0.0 | 12 | 0.0 | 546 | 0.1 | 5 | 0.0 | ||
| 521. Transport equipment, other than passenger motor vehicles, industrial | 10 | 0.0 | 533 | 0.1 | 5 | 0.0 | ||||
| 522. Transport equipment, other than passenger motor vehicles, non-industrial | 14 | 0.0 | 12 | 0.0 | 13 | 0.0 | ||||
| 53. Transport equipment, parts and accessories | 11,997 | 2.7 | 14,365 | 1.7 | 14,756 | 1.9 | 11,173 | 1.6 | 8,836 | 1.1 |
| 6. Consumer goods not elsewhere specified | 4,015 | 0.9 | 3,604 | 0.4 | 5,178 | 0.7 | 3,070 | 0.4 | 2,829 | 0.3 |
| 61. Consumer goods not elsewhere specified, durable | 343 | 0.1 | 253 | 0.0 | 124 | 0.0 | 168 | 0.0 | 180 | 0.0 |
| 62. Consumer goods not elsewhere specified, semi-durable | 1,725 | 0.4 | 2,091 | 0.2 | 2,999 | 0.4 | 1,843 | 0.3 | 1,447 | 0.2 |
| 63. Consumer goods not elsewhere specified, non-durable | 1,947 | 0.4 | 1,260 | 0.1 | 2,055 | 0.3 | 1,060 | 0.2 | 1,201 | 0.1 |
| 7. Goods not elsewhere specified | 489 | 0.1 | 1,261 | 0.1 | 583 | 0.1 | 539 | 0.1 | 577 | 0.1 |
| All groups | 440,002 | 100.0 | 853,238 | 100.0 | 785,226 | 100.0 | 695,766 | 100.0 | 830,225 | 100.0 |
| Classification | Description | Year level | Quarter level | Month level | |
|---|---|---|---|---|---|
| SITC | Standard International Trade Classification (classification system is maintained by the United Nations) | ███ | ███ | ███ | |
| BEC | The standard of statistical classification of BEC (Broad Economic Categories) is upheld by the UN and it is based on SITC-nomenclature. | ███ | ███ | ███ | |
| NACE | National industrial classification based on Statistical Classification of Economic Activities in the European Community Nomenclature générale des Activités économiques dans les Communautés européennes | ███ | ███ | ███ | |
| CPA | CPA = Classification of Products by Activities | ███ | ███ | ███ | |
| CN | The Combined Nomenclature is the common nomenclature of the European Community. | ███ | ███ | ███ |