
| Export of goods from Finland and import to Finland | Trade Balance |
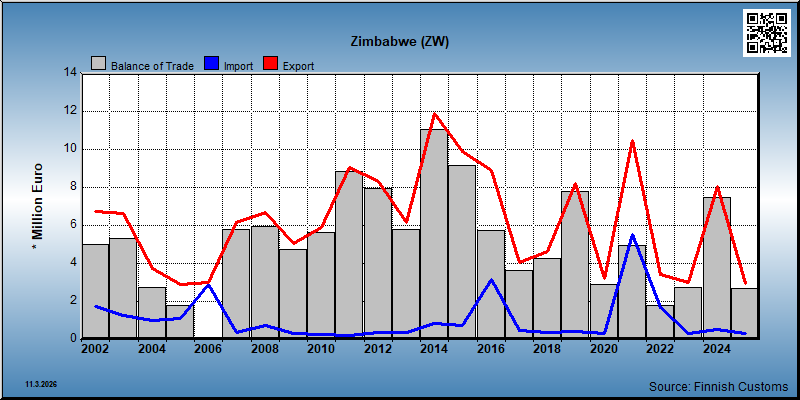
| Year | Import 1,000 € | Export 1,000 € | Trade 1,000 € | Trade balance 1,000 € |
|---|---|---|---|---|
| 2002 | 1,754 | 6,762 | 8,515 | 5,008 |
| 2003 | 1,287 | 6,618 | 7,905 | 5,332 |
| 2004 | 1,025 | 3,744 | 4,769 | 2,719 |
| 2005 | 1,098 | 2,901 | 3,999 | 1,802 |
| 2006 | 2,892 | 2,993 | 5,886 | 101 |
| 2007 | 377 | 6,183 | 6,560 | 5,806 |
| 2008 | 755 | 6,702 | 7,458 | 5,947 |
| 2009 | 331 | 5,078 | 5,409 | 4,747 |
| 2010 | 279 | 5,894 | 6,173 | 5,616 |
| 2011 | 187 | 9,034 | 9,220 | 8,847 |
| 2012 | 364 | 8,310 | 8,674 | 7,945 |
| 2013 | 362 | 6,151 | 6,513 | 5,790 |
| 2014 | 833 | 11,883 | 12,716 | 11,051 |
| 2015 | 731 | 9,891 | 10,622 | 9,160 |
| 2016 | 3,154 | 8,889 | 12,043 | 5,735 |
| 2017 | 454 | 4,076 | 4,530 | 3,623 |
| 2018 | 388 | 4,641 | 5,029 | 4,253 |
| 2019 | 396 | 8,192 | 8,589 | 7,796 |
| 2020 | 302 | 3,217 | 3,519 | 2,915 |
| 2021 | 5,524 | 10,484 | 16,007 | 4,960 |
| 2022 | 1,683 | 3,447 | 5,129 | 1,764 |
| 2023 | 304 | 3,023 | 3,327 | 2,719 |
| 2024 | 537 | 8,031 | 8,568 | 7,493 |
| 2025 | 297 | 2,969 | 3,266 | 2,673 |
*) SITC = Standard International Trade Classification (classification system is maintained by the United Nations)
| 2021 | 2022 | 2023 | 2024 | 2025 | ||||||
|---|---|---|---|---|---|---|---|---|---|---|
| 1,000 € | % | 1,000 € | % | 1,000 € | % | 1,000 € | % | 1,000 € | % | |
| 2. Crude materials,inedible,except fuels | 42 | 0.5 | ||||||||
| 25. Pulp and waste paper | 41 | 0.5 | ||||||||
| 26. Textile fibres and their wastes | 1 | 0.0 | ||||||||
| 3. Mineral fuels etc | 1 | 0.0 | 1 | 0.0 | 2 | 0.1 | ||||
| 33. Petroleum and products | 1 | 0.0 | 1 | 0.0 | 2 | 0.1 | ||||
| 5. Chemicals and related products,n.e.s. | 1,037 | 10.1 | 902 | 26.2 | 1,168 | 38.7 | 1,236 | 15.4 | 1,686 | 56.8 |
| 51. Organic chemicals | 1 | 0.0 | ||||||||
| 54. Medicinal and pharmaceutical products | 819 | 8.0 | 828 | 24.0 | 1,168 | 38.6 | 1,118 | 13.9 | 1,258 | 42.4 |
| 58. Plastics in non-primary forms | 218 | 2.1 | 74 | 2.2 | 116 | 1.4 | 428 | 14.4 | ||
| 6. Basic manufactures | 20 | 0.2 | 34 | 1.0 | 19 | 0.6 | 58 | 0.7 | 21 | 0.7 |
| 62. Rubber manufactures,n.e.s. | 4 | 0.0 | 7 | 0.2 | 6 | 0.2 | 10 | 0.1 | 9 | 0.3 |
| 65. Textile yarn,fabrics,made up articles,etc. | 12 | 0.1 | 9 | 0.3 | 2 | 0.1 | 3 | 0.0 | ||
| 66. Non-metallic mineral manufactures,n.e.s. | 11 | 0.3 | 10 | 0.3 | ||||||
| 67. Iron and steel | 4 | 0.0 | 6 | 0.2 | 4 | 0.1 | 4 | 0.1 | 1 | 0.0 |
| 69. Manufactures of metals,n.e.s. | 7 | 0.2 | 40 | 0.5 | 1 | 0.0 | ||||
| 7. Machinery,transport equipment | 8,981 | 87.4 | 2,274 | 66.0 | 1,373 | 45.4 | 6,583 | 82.0 | 1,178 | 39.7 |
| 71. Power generating machinery and equipment | 2 | 0.1 | 1 | 0.0 | 141 | 1.8 | ||||
| 72. Machinery for specialized industries | 2,896 | 28.2 | 460 | 13.3 | 93 | 3.1 | 591 | 7.4 | 829 | 27.9 |
| 73. Metal working machinery | 100 | 1.0 | 127 | 3.7 | 90 | 3.0 | 105 | 1.3 | 97 | 3.3 |
| 74. General industrial machinery n.e.s. | 526 | 5.1 | 326 | 9.5 | 211 | 7.0 | 923 | 11.5 | 54 | 1.8 |
| 75. Office machines and adp machines | 15 | 0.5 | ||||||||
| 76. Telecommunications and sound recording equipment | 16 | 0.2 | 527 | 15.3 | 79 | 2.6 | 111 | 1.4 | ||
| 77. Electric machinery,n.e.s.and parts | 46 | 0.5 | 66 | 1.9 | 37 | 1.2 | 56 | 0.7 | 183 | 6.1 |
| 78. Road vehicles | 5,397 | 52.5 | 766 | 22.2 | 862 | 28.5 | 4,656 | 58.0 | ||
| 8. Miscellaneous manufactured articles | 233 | 2.3 | 236 | 6.9 | 462 | 15.3 | 112 | 1.4 | 82 | 2.8 |
| 81. Prefabr.buildings;sanitary,lighting etc.fixtrs | 15 | 0.2 | ||||||||
| 84. Articles of apparel and clothing accessories | 7 | 0.1 | ||||||||
| 85. Footwear | 1 | 0.0 | ||||||||
| 87. Instruments and apparates n.e.s. | 223 | 2.2 | 42 | 1.2 | 444 | 14.7 | 59 | 0.7 | 59 | 2.0 |
| 89. Miscellaneous manufactured articles,n.e.s. | 10 | 0.1 | 194 | 5.6 | 18 | 0.6 | 30 | 0.4 | 24 | 0.8 |
| All groups combined | 10,271 | 100.0 | 3,447 | 100.0 | 3,023 | 100.0 | 8,031 | 100.0 | 2,969 | 100.0 |
| 2021 | 2022 | 2023 | 2024 | 2025 | ||||||
|---|---|---|---|---|---|---|---|---|---|---|
| 1,000 € | % | 1,000 € | % | 1,000 € | % | 1,000 € | % | 1,000 € | % | |
| 0. Food and live animals | 289 | 5.2 | 240 | 14.3 | 218 | 71.9 | 405 | 75.0 | 228 | 76.8 |
| 02. Dairy products and birds' eggs | 1 | 0.0 | ||||||||
| 05. Vegetables and fruit | 287 | 5.2 | 240 | 14.3 | 218 | 71.8 | 405 | 74.9 | 228 | 76.7 |
| 09. Miscellaneous edible products and preparations | 1 | 0.0 | ||||||||
| 1. Beverages and tobacco | 1 | 0.0 | ||||||||
| 11. Beverages | 1 | 0.0 | ||||||||
| 2. Crude materials,inedible,except fuels | 44 | 2.6 | 37 | 12.4 | 47 | 8.6 | 25 | 8.5 | ||
| 27. Crude fertilizers and crude minerals | 10 | 1.9 | ||||||||
| 29. Crude animal,vegetable materials n.e.s. | 44 | 2.6 | 37 | 12.4 | 36 | 6.7 | 25 | 8.5 | ||
| 5. Chemicals and related products,n.e.s. | 1 | 0.0 | ||||||||
| 59. Chemical materials and products,n.e.s. | 1 | 0.0 | ||||||||
| 6. Basic manufactures | 5,225 | 94.6 | 1,316 | 78.4 | ||||||
| 66. Non-metallic mineral manufactures,n.e.s. | 52 | 0.9 | ||||||||
| 67. Iron and steel | 5,173 | 93.7 | 1,316 | 78.3 | ||||||
| 7. Machinery,transport equipment | 8 | 0.1 | 7 | 2.4 | 11 | 2.1 | 1 | 0.4 | ||
| 72. Machinery for specialized industries | 6 | 0.1 | 5 | 1.5 | 7 | 1.4 | 1 | 0.3 | ||
| 73. Metal working machinery | 3 | 0.8 | 3 | 0.6 | ||||||
| 74. General industrial machinery n.e.s. | 2 | 0.0 | ||||||||
| 8. Miscellaneous manufactured articles | 75 | 4.5 | 40 | 13.1 | 77 | 14.2 | 42 | 14.2 | ||
| 83. Travel goods,handbags and sim.containers | 1 | 0.0 | 1 | 0.5 | 1 | 0.1 | ||||
| 84. Articles of apparel and clothing accessories | 1 | 0.1 | 14 | 4.5 | 12 | 2.2 | 7 | 2.5 | ||
| 85. Footwear | 11 | 0.6 | 23 | 7.7 | 57 | 10.6 | 33 | 11.3 | ||
| 87. Instruments and apparates n.e.s. | 61 | 3.6 | 1 | 0.4 | ||||||
| 88. Photographic equipment,optical goods etc. | 2 | 0.1 | 1 | 0.2 | ||||||
| 89. Miscellaneous manufactured articles,n.e.s. | 8 | 1.4 | ||||||||
| 9. Goods not classified elsewhere | 1 | 0.0 | 5 | 0.3 | ||||||
| 93. Special transactions and commodities not classified | 1 | 0.0 | 5 | 0.3 | ||||||
| All groups combined | 5,523 | 100.0 | 1,680 | 100.0 | 303 | 100.0 | 540 | 100.0 | 297 | 100.0 |
| Classification | Description | Year level | Quarter level | Month level | |
|---|---|---|---|---|---|
| SITC | Standard International Trade Classification (classification system is maintained by the United Nations) | ||||
| BEC | The standard of statistical classification of BEC (Broad Economic Categories) is upheld by the UN and it is based on SITC-nomenclature. | ||||
| NACE | National industrial classification based on Statistical Classification of Economic Activities in the European Community Nomenclature générale des Activités économiques dans les Communautés européennes | ||||
| CPA | CPA = Classification of Products by Activities | ||||
| CN | The Combined Nomenclature is the common nomenclature of the European Community. |