
| Export of goods from Finland and import to Finland | Trade Balance |
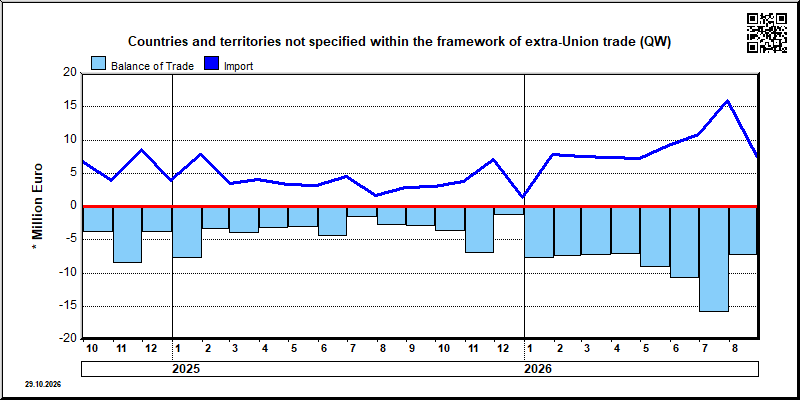
| Year | Month | Import 1,000 € | Export 1,000 € | Trade 1,000 € | Trade Balance 1,000 € |
|---|---|---|---|---|---|
| 2023 | 6 | 5 | 0 | 5 | -5 |
| 2024 | 1 | 8,224 | 0 | 8,224 | -8,224 |
| 2024 | 2 | 8,621 | 0 | 8,621 | -8,621 |
| 2024 | 3 | 11,682 | 0 | 11,682 | -11,682 |
| 2024 | 4 | 7,759 | 0 | 7,759 | -7,759 |
| 2024 | 5 | 6,868 | 0 | 6,868 | -6,868 |
| 2024 | 6 | 6,753 | 0 | 6,753 | -6,753 |
| 2024 | 7 | 7,448 | 0 | 7,448 | -7,448 |
| 2024 | 8 | 4,861 | 0 | 4,861 | -4,861 |
| 2024 | 9 | 6,722 | 0 | 6,722 | -6,722 |
| 2024 | 10 | 3,965 | 0 | 3,965 | -3,965 |
| 2024 | 11 | 8,545 | 0 | 8,545 | -8,545 |
| 2024 | 12 | 3,934 | 0 | 3,934 | -3,934 |
| 2025 | 1 | 7,860 | 0 | 7,860 | -7,860 |
| 2025 | 2 | 3,493 | 0 | 3,493 | -3,493 |
| 2025 | 3 | 4,119 | 0 | 4,119 | -4,119 |
| 2025 | 4 | 3,359 | 0 | 3,359 | -3,359 |
| 2025 | 5 | 3,120 | 0 | 3,120 | -3,120 |
| 2025 | 6 | 4,442 | 0 | 4,442 | -4,442 |
| 2025 | 7 | 1,627 | 0 | 1,627 | -1,627 |
| 2025 | 8 | 2,919 | 0 | 2,919 | -2,919 |
| 2025 | 9 | 3,029 | 0 | 3,029 | -3,029 |
| 2025 | 10 | 3,705 | 0 | 3,705 | -3,705 |
| 2025 | 11 | 7,010 | 0 | 7,010 | -7,010 |
| 2025 | 12 | 1,405 | 0 | 1,405 | -1,405 |
| 2026 | 1 | 7,792 | 0 | 7,792 | -7,792 |
| 2026 | 2 | 7,559 | 0 | 7,559 | -7,559 |
| 2026 | 3 | 7,388 | 0 | 7,388 | -7,388 |
| 2026 | 4 | 7,262 | 0 | 7,262 | -7,262 |
| 2026 | 5 | 9,230 | 0 | 9,230 | -9,230 |
| 2026 | 6 | 10,841 | 0 | 10,841 | -10,841 |
| 2026 | 7 | 15,865 | 0 | 15,865 | -15,865 |
| 2026 | 8 | 7,314 | 0 | 7,314 | -7,314 |
| 2026/4 | 2026/5 | 2026/6 | 2026/7 | 2026/8 | ||||||
|---|---|---|---|---|---|---|---|---|---|---|
| 1000 € | % | 1000 € | % | 1000 € | % | 1000 € | % | 1000 € | % | |
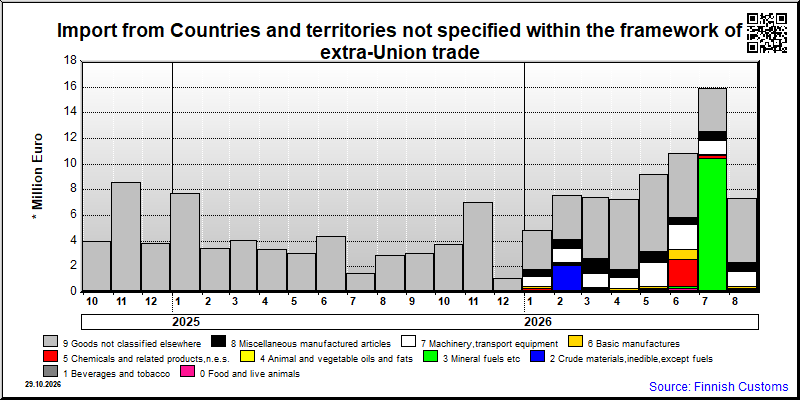
| 2026/4 | 2026/5 | 2026/6 | 2026/7 | 2026/8 | ||||||
|---|---|---|---|---|---|---|---|---|---|---|
| 1000 € | % | 1000 € | % | 1000 € | % | 1000 € | % | 1000 € | % | |
| 0. Food and live animals | 66 | 0.9 | 94 | 1.0 | 300 | 2.8 | 184 | 1.2 | 65 | 0.9 |
| 1. Beverages and tobacco | 27 | 0.2 | 1 | 0.0 | 8 | 0.1 | ||||
| 2. Crude materials,inedible,except fuels | 45 | 0.6 | 1 | 0.0 | 39 | 0.5 | ||||
| 3. Mineral fuels etc | 105 | 1.1 | 107 | 1.0 | 10,243 | 64.6 | 104 | 1.4 | ||
| 5. Chemicals and related products,n.e.s. | 28 | 0.4 | 120 | 1.3 | 2,107 | 19.4 | 244 | 1.5 | 71 | 1.0 |
| 6. Basic manufactures | 150 | 2.1 | 148 | 1.6 | 833 | 7.7 | 93 | 0.6 | 193 | 2.6 |
| 7. Machinery,transport equipment | 858 | 11.8 | 1,908 | 20.7 | 1,886 | 17.4 | 1,096 | 6.9 | 1,125 | 15.4 |
| 8. Miscellaneous manufactured articles | 624 | 8.6 | 803 | 8.7 | 551 | 5.1 | 649 | 4.1 | 723 | 9.9 |
| 9. Goods not classified elsewhere | 5,491 | 75.6 | 6,052 | 65.6 | 5,031 | 46.4 | 3,356 | 21.2 | 4,986 | 68.2 |
| All groups combined | 7,262 | 100.0 | 9,230 | 100.0 | 10,841 | 100.0 | 15,865 | 100.0 | 7,314 | 100.0 |
| Classification | Description | Year level | Quarter level | Month level | Year 2026 sofar |
|---|---|---|---|---|---|
| SITC | Standard International Trade Classification (classification system is maintained by the United Nations) | ███ | ███ | ███ | ███ |
| BEC | The standard of statistical classification of BEC (Broad Economic Categories) is upheld by the UN and it is based on SITC-nomenclature. | ███ | ███ | ███ | ███ |
| NACE | National industrial classification based on Statistical Classification of Economic Activities in the European Community Nomenclature générale des Activités économiques dans les Communautés européennes | ███ | ███ | ███ | ███ |
| CPA | CPA = Classification of Products by Activities | ███ | ███ | ███ | ███ |
| CN | The Combined Nomenclature is the common nomenclature of the European Community. | ███ | ███ | ███ | ███ |