
| Export of goods from Finland and import to Finland | Trade Balance |
The value of imports from Portugal was 82.3 per cent higher than in August of the previous year, thus amounting now to €39 million. More than half of the value of imports was in Sitc 287 (ores and concentrates of base metals, n.e.s.) representing a share of 59.6 per cent.
The value of exports to Portugal were 43.9 percent higher than in August of the previous year, thus amounting to €26 million. The largest product groups of exports were: Sitc 598 (miscellaneous chemical products, n.e.s.), which represented a share of 14.1 per cent of total exports, Sitc 641 (paper and paperboard) 8.5 % and Sitc 251 (pulp and waste paper) 8.3 % of the exports.
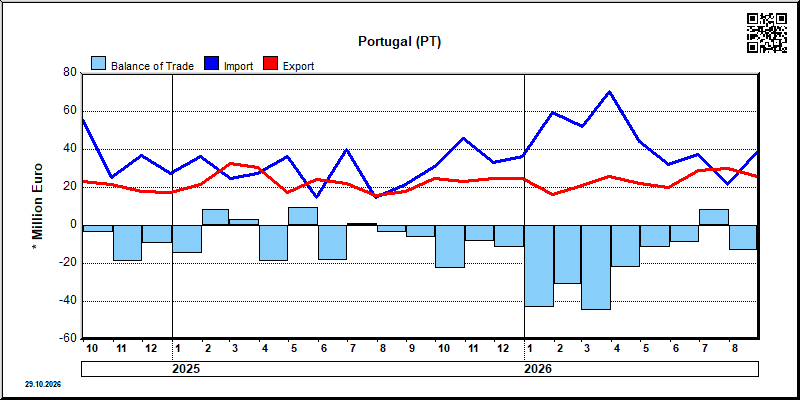
| Year | Month | Import 1,000 € | Export 1,000 € | Trade 1,000 € | Trade Balance 1,000 € |
|---|---|---|---|---|---|
| 2023 | 1 | 50,856 | 21,271 | 72,127 | -29,584 |
| 2023 | 2 | 24,524 | 19,349 | 43,873 | -5,175 |
| 2023 | 3 | 75,934 | 30,554 | 106,489 | -45,380 |
| 2023 | 4 | 30,928 | 19,446 | 50,374 | -11,482 |
| 2023 | 5 | 21,177 | 24,659 | 45,837 | 3,482 |
| 2023 | 6 | 42,932 | 22,895 | 65,827 | -20,036 |
| 2023 | 7 | 30,678 | 20,801 | 51,479 | -9,877 |
| 2023 | 8 | 25,408 | 16,296 | 41,704 | -9,113 |
| 2023 | 9 | 25,419 | 18,661 | 44,081 | -6,758 |
| 2023 | 10 | 22,742 | 21,325 | 44,068 | -1,417 |
| 2023 | 11 | 33,972 | 24,985 | 58,956 | -8,987 |
| 2023 | 12 | 21,720 | 18,287 | 40,007 | -3,433 |
| 2024 | 1 | 32,560 | 15,797 | 48,357 | -16,762 |
| 2024 | 2 | 76,550 | 18,904 | 95,454 | -57,646 |
| 2024 | 3 | 27,622 | 16,089 | 43,711 | -11,534 |
| 2024 | 4 | 89,660 | 19,441 | 109,100 | -70,219 |
| 2024 | 5 | 52,273 | 27,977 | 80,250 | -24,296 |
| 2024 | 6 | 37,920 | 18,685 | 56,605 | -19,235 |
| 2024 | 7 | 23,963 | 20,313 | 44,276 | -3,650 |
| 2024 | 8 | 47,868 | 17,999 | 65,868 | -29,869 |
| 2024 | 9 | 55,693 | 23,050 | 78,743 | -32,643 |
| 2024 | 10 | 25,286 | 21,380 | 46,665 | -3,906 |
| 2024 | 11 | 36,836 | 17,889 | 54,725 | -18,947 |
| 2024 | 12 | 27,115 | 17,575 | 44,690 | -9,540 |
| 2025 | 1 | 36,316 | 21,521 | 57,837 | -14,796 |
| 2025 | 2 | 24,486 | 32,719 | 57,205 | 8,233 |
| 2025 | 3 | 27,374 | 30,692 | 58,066 | 3,317 |
| 2025 | 4 | 36,305 | 17,491 | 53,795 | -18,814 |
| 2025 | 5 | 14,766 | 24,359 | 39,125 | 9,594 |
| 2025 | 6 | 40,210 | 22,044 | 62,254 | -18,166 |
| 2025 | 7 | 14,560 | 15,858 | 30,418 | 1,298 |
| 2025 | 8 | 21,372 | 17,950 | 39,323 | -3,422 |
| 2025 | 9 | 30,919 | 24,671 | 55,590 | -6,247 |
| 2025 | 10 | 45,791 | 23,110 | 68,901 | -22,682 |
| 2025 | 11 | 33,206 | 24,746 | 57,953 | -8,460 |
| 2025 | 12 | 36,245 | 24,562 | 60,808 | -11,683 |
| 2026 | 1 | 59,522 | 16,440 | 75,962 | -43,082 |
| 2026 | 2 | 51,940 | 20,864 | 72,804 | -31,076 |
| 2026 | 3 | 70,760 | 25,766 | 96,526 | -44,994 |
| 2026 | 4 | 44,246 | 22,278 | 66,525 | -21,968 |
| 2026 | 5 | 31,960 | 20,122 | 52,082 | -11,838 |
| 2026 | 6 | 37,540 | 28,809 | 66,350 | -8,731 |
| 2026 | 7 | 21,614 | 30,142 | 51,755 | 8,528 |
| 2026 | 8 | 38,957 | 25,838 | 64,796 | -13,119 |
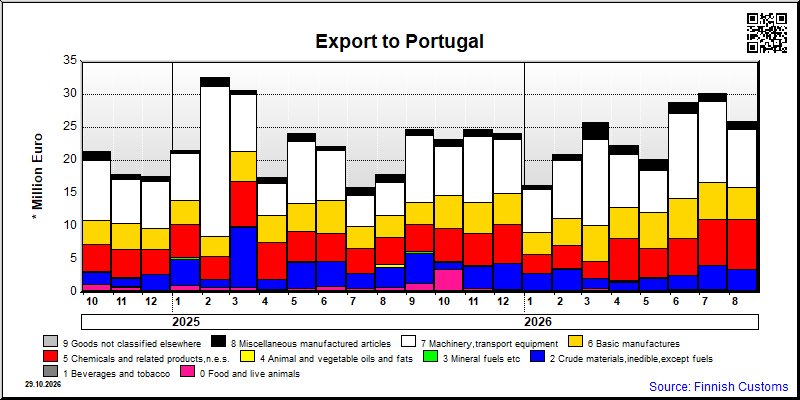
| 2026/4 | 2026/5 | 2026/6 | 2026/7 | 2026/8 | ||||||
|---|---|---|---|---|---|---|---|---|---|---|
| 1000 € | % | 1000 € | % | 1000 € | % | 1000 € | % | 1000 € | % | |
| 0. Food and live animals | 280 | 1.3 | 375 | 1.9 | 446 | 1.5 | 507 | 1.7 | 335 | 1.3 |
| 1. Beverages and tobacco | 18 | 0.1 | 10 | 0.0 | 12 | 0.0 | ||||
| 2. Crude materials,inedible,except fuels | 1,284 | 5.8 | 1,778 | 8.8 | 2,136 | 7.4 | 3,564 | 11.8 | 3,161 | 12.2 |
| 3. Mineral fuels etc | 89 | 0.4 | 44 | 0.2 | 2 | 0.0 | 48 | 0.2 | 3 | 0.0 |
| 4. Animal and vegetable oils and fats | 178 | 0.8 | ||||||||
| 5. Chemicals and related products,n.e.s. | 6,313 | 28.3 | 4,510 | 22.4 | 5,571 | 19.3 | 6,947 | 23.0 | 7,500 | 29.0 |
| 6. Basic manufactures | 4,705 | 21.1 | 5,340 | 26.5 | 6,058 | 21.0 | 5,513 | 18.3 | 4,895 | 18.9 |
| 7. Machinery,transport equipment | 8,084 | 36.3 | 6,438 | 32.0 | 12,912 | 44.8 | 12,335 | 40.9 | 8,757 | 33.9 |
| 8. Miscellaneous manufactured articles | 1,243 | 5.6 | 1,551 | 7.7 | 1,588 | 5.5 | 1,131 | 3.8 | 1,103 | 4.3 |
| 9. Goods not classified elsewhere | 85 | 0.4 | 85 | 0.4 | 85 | 0.3 | 85 | 0.3 | 85 | 0.3 |
| All groups combined | 22,278 | 100.0 | 20,122 | 100.0 | 28,809 | 100.0 | 30,142 | 100.0 | 25,838 | 100.0 |
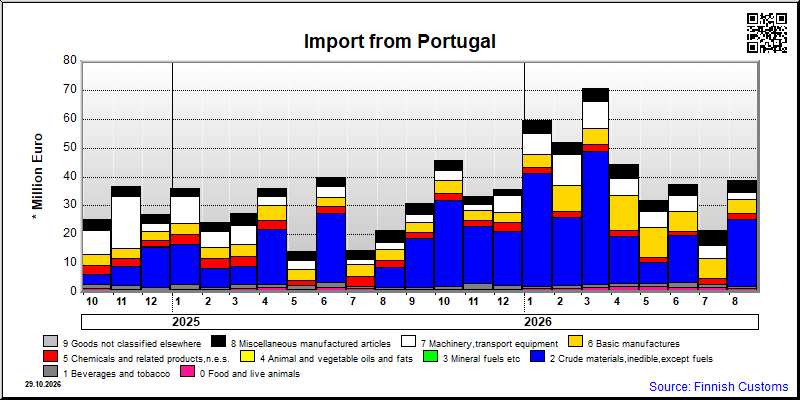
| 2026/4 | 2026/5 | 2026/6 | 2026/7 | 2026/8 | ||||||
|---|---|---|---|---|---|---|---|---|---|---|
| 1000 € | % | 1000 € | % | 1000 € | % | 1000 € | % | 1000 € | % | |
| 0. Food and live animals | 2,136 | 4.8 | 1,998 | 6.3 | 1,716 | 4.6 | 1,756 | 8.1 | 1,337 | 3.4 |
| 1. Beverages and tobacco | 1,012 | 2.3 | 1,157 | 3.6 | 1,845 | 4.9 | 844 | 3.9 | 670 | 1.7 |
| 2. Crude materials,inedible,except fuels | 16,375 | 37.0 | 7,209 | 22.6 | 16,201 | 43.2 | 204 | 0.9 | 23,367 | 60.0 |
| 3. Mineral fuels etc | 2 | 0.0 | 1 | 0.0 | 4 | 0.0 | 4 | 0.0 | ||
| 4. Animal and vegetable oils and fats | 1 | 0.0 | 11 | 0.0 | 1 | 0.0 | 1 | 0.0 | 15 | 0.0 |
| 5. Chemicals and related products,n.e.s. | 2,109 | 4.8 | 1,650 | 5.2 | 1,518 | 4.0 | 2,063 | 9.5 | 2,114 | 5.4 |
| 6. Basic manufactures | 12,009 | 27.1 | 10,554 | 33.0 | 6,867 | 18.3 | 6,790 | 31.4 | 4,547 | 11.7 |
| 7. Machinery,transport equipment | 5,920 | 13.4 | 5,633 | 17.6 | 5,372 | 14.3 | 4,688 | 21.7 | 2,626 | 6.7 |
| 8. Miscellaneous manufactured articles | 4,684 | 10.6 | 3,745 | 11.7 | 4,020 | 10.7 | 5,265 | 24.4 | 4,277 | 11.0 |
| All groups combined | 44,246 | 100.0 | 31,960 | 100.0 | 37,540 | 100.0 | 21,614 | 100.0 | 38,957 | 100.0 |
| Classification | Description | Year level | Quarter level | Month level | Year 2026 sofar |
|---|---|---|---|---|---|
| SITC | Standard International Trade Classification (classification system is maintained by the United Nations) | ███ | ███ | ███ | ███ |
| BEC | The standard of statistical classification of BEC (Broad Economic Categories) is upheld by the UN and it is based on SITC-nomenclature. | ███ | ███ | ███ | ███ |
| NACE | National industrial classification based on Statistical Classification of Economic Activities in the European Community Nomenclature générale des Activités économiques dans les Communautés européennes | ███ | ███ | ███ | ███ |
| CPA | CPA = Classification of Products by Activities | ███ | ███ | ███ | ███ |
| CN | The Combined Nomenclature is the common nomenclature of the European Community. | ███ | ███ | ███ | ███ |