
| Export of goods from Finland and import to Finland | Trade Balance |
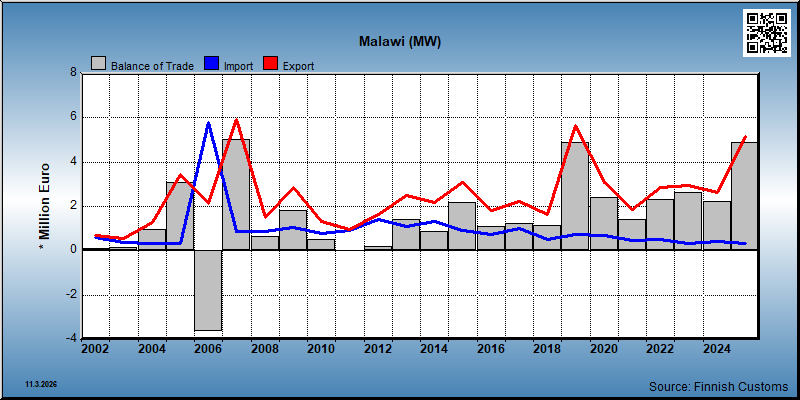
| Year | Import 1,000 € | Export 1,000 € | Trade 1,000 € | Trade balance 1,000 € |
|---|---|---|---|---|
| 2002 | 588 | 693 | 1,281 | 105 |
| 2003 | 392 | 564 | 956 | 172 |
| 2004 | 320 | 1,280 | 1,600 | 960 |
| 2005 | 347 | 3,437 | 3,784 | 3,089 |
| 2006 | 5,799 | 2,142 | 7,941 | -3,656 |
| 2007 | 862 | 5,904 | 6,766 | 5,042 |
| 2008 | 857 | 1,491 | 2,348 | 634 |
| 2009 | 1,054 | 2,876 | 3,930 | 1,822 |
| 2010 | 788 | 1,306 | 2,094 | 518 |
| 2011 | 925 | 957 | 1,882 | 32 |
| 2012 | 1,418 | 1,619 | 3,036 | 201 |
| 2013 | 1,087 | 2,479 | 3,566 | 1,392 |
| 2014 | 1,330 | 2,196 | 3,526 | 866 |
| 2015 | 905 | 3,067 | 3,972 | 2,162 |
| 2016 | 733 | 1,830 | 2,564 | 1,097 |
| 2017 | 1,013 | 2,241 | 3,254 | 1,227 |
| 2018 | 509 | 1,647 | 2,156 | 1,139 |
| 2019 | 746 | 5,651 | 6,398 | 4,905 |
| 2020 | 671 | 3,074 | 3,745 | 2,403 |
| 2021 | 474 | 1,873 | 2,347 | 1,399 |
| 2022 | 526 | 2,841 | 3,367 | 2,315 |
| 2023 | 310 | 2,947 | 3,257 | 2,636 |
| 2024 | 430 | 2,633 | 3,063 | 2,204 |
| 2025 | 311 | 5,176 | 5,487 | 4,865 |
*) SITC = Standard International Trade Classification (classification system is maintained by the United Nations)
| 2021 | 2022 | 2023 | 2024 | 2025 | ||||||
|---|---|---|---|---|---|---|---|---|---|---|
| 1,000 € | % | 1,000 € | % | 1,000 € | % | 1,000 € | % | 1,000 € | % | |
| 2. Crude materials,inedible,except fuels | 24 | 1.3 | 58 | 2.1 | 30 | 1.0 | 52 | 2.0 | ||
| 26. Textile fibres and their wastes | 24 | 1.3 | 58 | 2.1 | 30 | 1.0 | 52 | 2.0 | ||
| 5. Chemicals and related products,n.e.s. | 1,620 | 86.5 | 2,587 | 91.1 | 2,608 | 88.5 | 2,262 | 85.9 | 3,392 | 65.5 |
| 54. Medicinal and pharmaceutical products | 349 | 18.6 | 844 | 29.7 | 1,120 | 38.0 | 449 | 17.1 | 243 | 4.7 |
| 58. Plastics in non-primary forms | 1,271 | 67.9 | 1,743 | 61.4 | 1,488 | 50.5 | 1,813 | 68.9 | 3,149 | 60.8 |
| 6. Basic manufactures | 53 | 2.8 | 40 | 1.4 | 89 | 3.0 | 6 | 0.2 | 116 | 2.2 |
| 62. Rubber manufactures,n.e.s. | 2 | 0.1 | 6 | 0.2 | 6 | 0.2 | 5 | 0.2 | 4 | 0.1 |
| 63. Wood and cork manufactures | 1 | 0.0 | ||||||||
| 64. Paper,paperboard and articles thereof | 32 | 1.7 | 24 | 0.8 | 74 | 2.5 | 111 | 2.2 | ||
| 65. Textile yarn,fabrics,made up articles,etc. | 5 | 0.3 | 3 | 0.1 | 1 | 0.0 | ||||
| 66. Non-metallic mineral manufactures,n.e.s. | 1 | 0.0 | 1 | 0.0 | ||||||
| 67. Iron and steel | 1 | 0.0 | 4 | 0.1 | 1 | 0.0 | ||||
| 68. Non-ferrous metals | 5 | 0.2 | 1 | 0.0 | ||||||
| 69. Manufactures of metals,n.e.s. | 13 | 0.7 | 1 | 0.0 | 1 | 0.0 | ||||
| 7. Machinery,transport equipment | 130 | 6.9 | 71 | 2.5 | 120 | 4.1 | 65 | 2.5 | 1,011 | 19.5 |
| 71. Power generating machinery and equipment | 5 | 0.2 | ||||||||
| 72. Machinery for specialized industries | 44 | 2.3 | 7 | 0.2 | 44 | 1.5 | 9 | 0.3 | 932 | 18.0 |
| 74. General industrial machinery n.e.s. | 69 | 3.7 | 25 | 0.9 | 51 | 1.7 | 41 | 1.6 | 57 | 1.1 |
| 76. Telecommunications and sound recording equipment | 2 | 0.1 | 3 | 0.1 | 2 | 0.1 | ||||
| 77. Electric machinery,n.e.s.and parts | 14 | 0.8 | 31 | 1.1 | 21 | 0.7 | 15 | 0.6 | 21 | 0.4 |
| 78. Road vehicles | 1 | 0.0 | ||||||||
| 8. Miscellaneous manufactured articles | 46 | 2.5 | 85 | 3.0 | 100 | 3.4 | 247 | 9.4 | 657 | 12.7 |
| 82. Furniture and parts thereof | 3 | 0.1 | ||||||||
| 84. Articles of apparel and clothing accessories | 1 | 0.0 | ||||||||
| 87. Instruments and apparates n.e.s. | 40 | 2.1 | 37 | 1.3 | 54 | 1.8 | 3 | 0.1 | 439 | 8.5 |
| 89. Miscellaneous manufactured articles,n.e.s. | 6 | 0.3 | 47 | 1.6 | 43 | 1.4 | 243 | 9.2 | 218 | 4.2 |
| All groups combined | 1,873 | 100.0 | 2,841 | 100.0 | 2,947 | 100.0 | 2,633 | 100.0 | 5,176 | 100.0 |
| 2021 | 2022 | 2023 | 2024 | 2025 | ||||||
|---|---|---|---|---|---|---|---|---|---|---|
| 1,000 € | % | 1,000 € | % | 1,000 € | % | 1,000 € | % | 1,000 € | % | |
| 0. Food and live animals | 385 | 81.2 | 502 | 95.5 | 310 | 99.9 | 412 | 95.8 | 293 | 94.4 |
| 03. Fish and fish preparations | 7 | 1.5 | ||||||||
| 05. Vegetables and fruit | 1 | 0.2 | 1 | 0.5 | ||||||
| 06. Sugars,sugar preparations and honey | 370 | 78.0 | 295 | 56.2 | 77 | 24.8 | 58 | 13.4 | 64 | 20.5 |
| 07. Coffee,tea,cocoa,spices | 8 | 1.6 | 206 | 39.3 | 233 | 75.1 | 354 | 82.3 | 228 | 73.3 |
| 6. Basic manufactures | 1 | 0.4 | ||||||||
| 66. Non-metallic mineral manufactures,n.e.s. | 1 | 0.3 | ||||||||
| 7. Machinery,transport equipment | 4 | 0.8 | 18 | 4.1 | 6 | 1.9 | ||||
| 74. General industrial machinery n.e.s. | 2 | 0.5 | ||||||||
| 77. Electric machinery,n.e.s.and parts | 1 | 0.1 | 18 | 4.1 | 6 | 1.9 | ||||
| 78. Road vehicles | 1 | 0.1 | ||||||||
| 8. Miscellaneous manufactured articles | 85 | 18.0 | 23 | 4.4 | 10 | 3.3 | ||||
| 81. Prefabr.buildings;sanitary,lighting etc.fixtrs | 2 | 0.5 | ||||||||
| 82. Furniture and parts thereof | 8 | 2.7 | ||||||||
| 87. Instruments and apparates n.e.s. | 1 | 0.3 | ||||||||
| 89. Miscellaneous manufactured articles,n.e.s. | 84 | 17.7 | 23 | 4.4 | ||||||
| 9. Goods not classified elsewhere | 2 | 0.4 | ||||||||
| 93. Special transactions and commodities not classified | 2 | 0.4 | ||||||||
| All groups combined | 474 | 100.0 | 526 | 100.0 | 311 | 100.0 | 430 | 100.0 | 311 | 100.0 |
| Classification | Description | Year level | Quarter level | Month level | |
|---|---|---|---|---|---|
| SITC | Standard International Trade Classification (classification system is maintained by the United Nations) | ||||
| BEC | The standard of statistical classification of BEC (Broad Economic Categories) is upheld by the UN and it is based on SITC-nomenclature. | ||||
| NACE | National industrial classification based on Statistical Classification of Economic Activities in the European Community Nomenclature générale des Activités économiques dans les Communautés européennes | ||||
| CPA | CPA = Classification of Products by Activities | ||||
| CN | The Combined Nomenclature is the common nomenclature of the European Community. |