
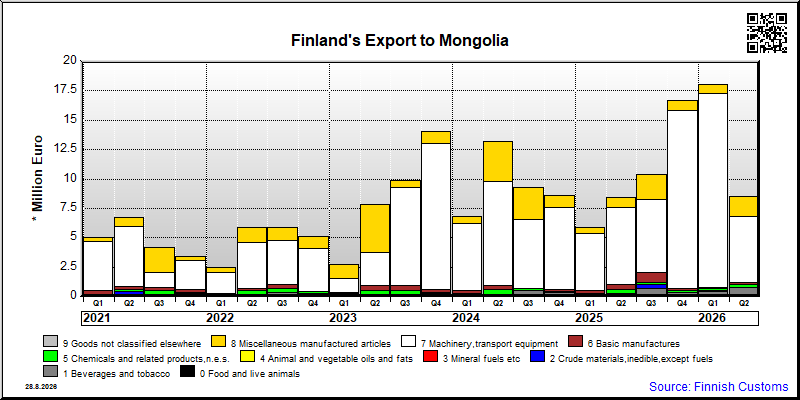
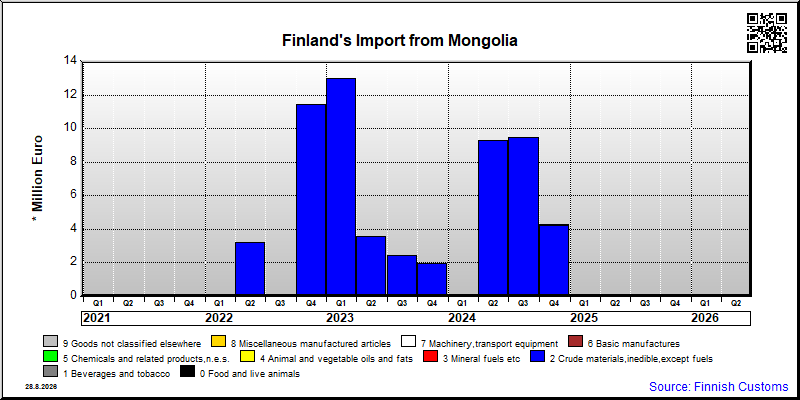
| Export of goods from Finland and import to Finland | Trade Balance |

| Import 1,000 € | Export 1,000 € | Trade 1,000 € | Trade Balance 1,000 € | |
|---|---|---|---|---|
| 2019 Q1 | 1,512 | 1,606 | 3,118 | 94 |
| 2019 Q2 | 51 | 1,966 | 2,017 | 1,915 |
| 2019 Q3 | 62 | 1,238 | 1,300 | 1,176 |
| 2019 Q4 | 28 | 4,339 | 4,366 | 4,311 |
| 2020 Q1 | 10 | 2,011 | 2,021 | 2,001 |
| 2020 Q2 | 18 | 2,659 | 2,677 | 2,641 |
| 2020 Q3 | 61 | 2,305 | 2,366 | 2,244 |
| 2020 Q4 | 46 | 3,314 | 3,359 | 3,268 |
| 2021 Q1 | 16 | 5,039 | 5,055 | 5,023 |
| 2021 Q2 | 3 | 6,687 | 6,690 | 6,684 |
| 2021 Q3 | 1 | 4,193 | 4,194 | 4,191 |
| 2021 Q4 | 13 | 3,455 | 3,468 | 3,442 |
| 2022 Q1 | 10 | 2,437 | 2,447 | 2,427 |
| 2022 Q2 | 3,215 | 5,873 | 9,088 | 2,657 |
| 2022 Q3 | 9 | 5,888 | 5,897 | 5,879 |
| 2022 Q4 | 5,736 | 5,095 | 10,832 | -641 |
| 2023 Q1 | 13,015 | 2,708 | 15,724 | -10,307 |
| 2023 Q2 | 3,578 | 7,799 | 11,377 | 4,221 |
| 2023 Q3 | 2,466 | 9,889 | 12,355 | 7,423 |
| 2023 Q4 | 1,993 | 14,040 | 16,034 | 12,047 |
| 2024 Q1 | 3 | 6,809 | 6,812 | 6,807 |
| 2024 Q2 | 9,282 | 13,174 | 22,456 | 3,892 |
| 2024 Q3 | 9,459 | 9,264 | 18,722 | -195 |
| 2024 Q4 | 4,284 | 8,585 | 12,870 | 4,301 |
| 2025 Q1 | 37 | 5,879 | 5,915 | 5,842 |
| 2025 Q2 | 2 | 8,397 | 8,399 | 8,395 |
| 2025 Q3 | 26 | 10,353 | 10,379 | 10,327 |
| 2025 Q4 | 7 | 16,674 | 16,681 | 16,667 |
| 2026 Q1 | 2 | 18,063 | 18,065 | 18,061 |
| 2026 Q2 | 3 | 8,548 | 8,551 | 8,545 |
| Q2 / 2026 | Q2 / 2025 | Muutos edellisestä vastaavasta kaudesta % | ||
|---|---|---|---|---|
| 1,000 € | % | 1,000 € | ||
| 0. Food and live animals | 30 | 0.4 | 0 | .. |
| 1. Beverages and tobacco | 754 | 8.8 | 193 | 289.9 |
| 2. Crude materials,inedible,except fuels | 4 | 0.0 | 52 | -91.9 |
| 3. Mineral fuels etc | 0 | 0.0 | 0 | 4.7 |
| 5. Chemicals and related products,n.e.s. | 268 | 3.1 | 310 | -13.4 |
| 6. Basic manufactures | 126 | 1.5 | 500 | -74.8 |
| 7. Machinery,transport equipment | 5,602 | 65.5 | 6,502 | -13.8 |
| 8. Miscellaneous manufactured articles | 1,763 | 20.6 | 840 | 110.0 |
| All groups combined | 8,548 | 100.0 | 8,397 | 1.8 |
| Q2 / 2026 | Q2 / 2025 | Muutos edellisestä vastaavasta kaudesta % | ||
|---|---|---|---|---|
| 1,000 € | % | 1,000 € | ||
| 0. Food and live animals | 1 | 17.0 | 0 | .. |
| 5. Chemicals and related products,n.e.s. | 1 | 16.8 | 0 | .. |
| 7. Machinery,transport equipment | 0 | 0 | 0 | .. |
| 8. Miscellaneous manufactured articles | 2 | 65.6 | 2 | 24.8 |
| 9. Goods not classified elsewhere | 0 | 0.6 | 0 | -91.5 |
| All groups combined | 3 | 100.0 | 2 | 62.4 |
| Classification | Description | Year level | Quarter level | Month level | Year 2026 sofar |
|---|---|---|---|---|---|
| SITC | Standard International Trade Classification (classification system is maintained by the United Nations) | ███ | ███ | ███ | ███ |
| BEC | The standard of statistical classification of BEC (Broad Economic Categories) is upheld by the UN and it is based on SITC-nomenclature. | ███ | ███ | ███ | ███ |
| NACE | National industrial classification based on Statistical Classification of Economic Activities in the European Community Nomenclature générale des Activités économiques dans les Communautés européennes | ███ | ███ | ███ | ███ |
| CPA | CPA = Classification of Products by Activities | ███ | ███ | ███ | ███ |
| CN | The Combined Nomenclature is the common nomenclature of the European Community. | ███ | ███ | ███ | ███ |