
| Export of goods from Finland and import to Finland | Trade Balance |

| Import 1,000 € | Export 1,000 € | Trade 1,000 € | Trade Balance 1,000 € | |
|---|---|---|---|---|
| 2019 Q1 | 7,501 | 76,163 | 83,664 | 68,661 |
| 2019 Q2 | 5,397 | 26,995 | 32,392 | 21,598 |
| 2019 Q3 | 5,288 | 19,339 | 24,627 | 14,052 |
| 2019 Q4 | 5,941 | 32,161 | 38,102 | 26,220 |
| 2020 Q1 | 6,413 | 42,619 | 49,032 | 36,207 |
| 2020 Q2 | 5,607 | 22,142 | 27,749 | 16,535 |
| 2020 Q3 | 5,221 | 39,650 | 44,871 | 34,429 |
| 2020 Q4 | 5,190 | 37,999 | 43,189 | 32,808 |
| 2021 Q1 | 10,016 | 28,732 | 38,748 | 18,716 |
| 2021 Q2 | 14,688 | 30,864 | 45,553 | 16,176 |
| 2021 Q3 | 7,348 | 23,043 | 30,392 | 15,695 |
| 2021 Q4 | 6,908 | 34,221 | 41,129 | 27,313 |
| 2022 Q1 | 11,883 | 30,868 | 42,750 | 18,985 |
| 2022 Q2 | 11,555 | 34,423 | 45,979 | 22,868 |
| 2022 Q3 | 21,155 | 36,213 | 57,368 | 15,058 |
| 2022 Q4 | 14,158 | 39,634 | 53,792 | 25,476 |
| 2023 Q1 | 20,646 | 25,632 | 46,278 | 4,986 |
| 2023 Q2 | 9,533 | 29,353 | 38,885 | 19,820 |
| 2023 Q3 | 14,425 | 58,446 | 72,871 | 44,020 |
| 2023 Q4 | 5,727 | 29,737 | 35,465 | 24,010 |
| 2024 Q1 | 8,713 | 24,395 | 33,108 | 15,682 |
| 2024 Q2 | 22,593 | 50,868 | 73,461 | 28,275 |
| 2024 Q3 | 7,156 | 41,593 | 48,750 | 34,437 |
| 2024 Q4 | 21,620 | 41,157 | 62,778 | 19,537 |
| 2025 Q1 | 16,862 | 36,121 | 52,984 | 19,259 |
| 2025 Q2 | 14,725 | 39,725 | 54,450 | 25,000 |
| 2025 Q3 | 14,034 | 22,462 | 36,496 | 8,428 |
| 2025 Q4 | 41,442 | 28,910 | 70,351 | -12,532 |
| 2026 Q1 | 71,946 | 25,233 | 97,179 | -46,712 |
| 2026 Q2 | 46,700 | 71,325 | 118,025 | 24,626 |

| Q2 / 2026 | Q2 / 2025 | Muutos edellisestä vastaavasta kaudesta % | ||
|---|---|---|---|---|
| 1,000 € | % | 1,000 € | ||
| 1. Beverages and tobacco | 0 | 0 | 25 | .. |
| 2. Crude materials,inedible,except fuels | 15,754 | 22.1 | 15,753 | 0.0 |
| 5. Chemicals and related products,n.e.s. | 39,139 | 54.9 | 11,819 | 231.1 |
| 6. Basic manufactures | 10,467 | 14.7 | 7,422 | 41.0 |
| 7. Machinery,transport equipment | 5,374 | 7.5 | 4,160 | 29.2 |
| 8. Miscellaneous manufactured articles | 592 | 0.8 | 545 | 8.5 |
| All groups combined | 71,325 | 100.0 | 39,725 | 79.5 |
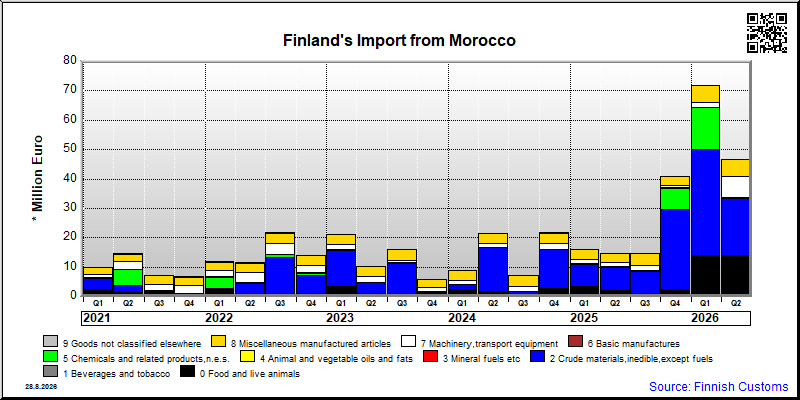
| Q2 / 2026 | Q2 / 2025 | Muutos edellisestä vastaavasta kaudesta % | ||
|---|---|---|---|---|
| 1,000 € | % | 1,000 € | ||
| 0. Food and live animals | 14,099 | 30.2 | 2,071 | 580.8 |
| 1. Beverages and tobacco | 0 | 0.0 | 0 | .. |
| 2. Crude materials,inedible,except fuels | 19,261 | 41.2 | 7,699 | 150.2 |
| 4. Animal and vegetable oils and fats | 26 | 0.1 | 32 | -18.9 |
| 5. Chemicals and related products,n.e.s. | 149 | 0.3 | 181 | -17.5 |
| 6. Basic manufactures | 309 | 0.7 | 140 | 120.5 |
| 7. Machinery,transport equipment | 6,935 | 14.9 | 1,621 | 327.9 |
| 8. Miscellaneous manufactured articles | 5,916 | 12.7 | 2,980 | 98.5 |
| 9. Goods not classified elsewhere | 4 | 0.0 | 4 | 4.4 |
| All groups combined | 46,700 | 100.0 | 14,729 | 217.1 |
| Classification | Description | Year level | Quarter level | Month level | Year 2026 sofar |
|---|---|---|---|---|---|
| SITC | Standard International Trade Classification (classification system is maintained by the United Nations) | ███ | ███ | ███ | ███ |
| BEC | The standard of statistical classification of BEC (Broad Economic Categories) is upheld by the UN and it is based on SITC-nomenclature. | ███ | ███ | ███ | ███ |
| NACE | National industrial classification based on Statistical Classification of Economic Activities in the European Community Nomenclature générale des Activités économiques dans les Communautés européennes | ███ | ███ | ███ | ███ |
| CPA | CPA = Classification of Products by Activities | ███ | ███ | ███ | ███ |
| CN | The Combined Nomenclature is the common nomenclature of the European Community. | ███ | ███ | ███ | ███ |