
| Export of goods from Finland and import to Finland | Trade Balance |

| Import 1,000 € | Export 1,000 € | Trade 1,000 € | Trade Balance 1,000 € | |
|---|---|---|---|---|
| 2019 Q1 | 69,888 | 151,467 | 221,355 | 81,579 |
| 2019 Q2 | 69,506 | 164,017 | 233,523 | 94,511 |
| 2019 Q3 | 78,446 | 150,732 | 229,178 | 72,286 |
| 2019 Q4 | 79,446 | 148,326 | 227,772 | 68,880 |
| 2020 Q1 | 72,745 | 131,838 | 204,583 | 59,093 |
| 2020 Q2 | 81,985 | 121,159 | 203,144 | 39,174 |
| 2020 Q3 | 71,223 | 147,036 | 218,259 | 75,812 |
| 2020 Q4 | 82,032 | 151,757 | 233,789 | 69,726 |
| 2021 Q1 | 72,156 | 142,545 | 214,701 | 70,389 |
| 2021 Q2 | 82,892 | 160,469 | 243,361 | 77,578 |
| 2021 Q3 | 86,030 | 174,986 | 261,017 | 88,956 |
| 2021 Q4 | 93,109 | 179,344 | 272,453 | 86,235 |
| 2022 Q1 | 84,982 | 183,328 | 268,310 | 98,346 |
| 2022 Q2 | 105,219 | 209,579 | 314,798 | 104,361 |
| 2022 Q3 | 130,125 | 204,370 | 334,494 | 74,245 |
| 2022 Q4 | 132,468 | 217,812 | 350,281 | 85,344 |
| 2023 Q1 | 131,526 | 210,808 | 342,334 | 79,283 |
| 2023 Q2 | 134,874 | 208,167 | 343,041 | 73,293 |
| 2023 Q3 | 117,999 | 194,866 | 312,865 | 76,866 |
| 2023 Q4 | 123,500 | 194,514 | 318,014 | 71,014 |
| 2024 Q1 | 119,369 | 191,712 | 311,080 | 72,343 |
| 2024 Q2 | 141,096 | 188,044 | 329,140 | 46,948 |
| 2024 Q3 | 142,205 | 214,662 | 356,867 | 72,456 |
| 2024 Q4 | 123,277 | 394,044 | 517,321 | 270,767 |
| 2025 Q1 | 113,759 | 365,018 | 478,776 | 251,259 |
| 2025 Q2 | 114,684 | 253,881 | 368,564 | 139,197 |
| 2025 Q3 | 122,733 | 211,424 | 334,157 | 88,691 |
| 2025 Q4 | 110,266 | 202,280 | 312,546 | 92,014 |
| 2026 Q1 | 98,022 | 336,443 | 434,465 | 238,421 |
| 2026 Q2 | 109,394 | 210,396 | 319,790 | 101,003 |
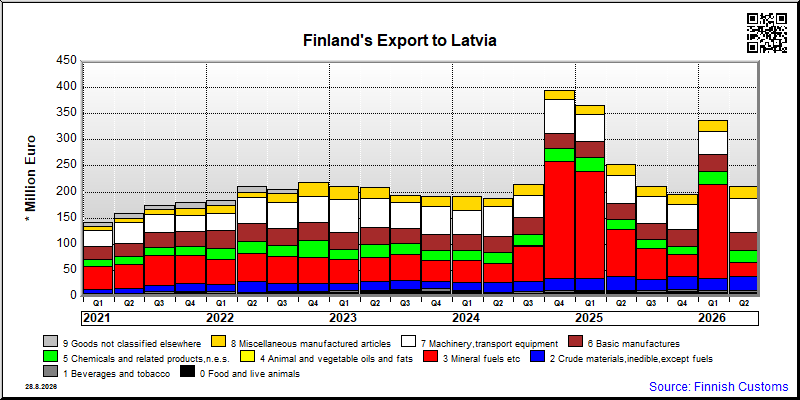
| Q2 / 2026 | Q2 / 2025 | Muutos edellisestä vastaavasta kaudesta % | ||
|---|---|---|---|---|
| 1,000 € | % | 1,000 € | ||
| 0. Food and live animals | 6,750 | 3.2 | 9,285 | -27.3 |
| 1. Beverages and tobacco | 3,789 | 1.8 | 2,551 | 48.5 |
| 2. Crude materials,inedible,except fuels | 27,168 | 12.9 | 26,431 | 2.8 |
| 3. Mineral fuels etc | 26,723 | 12.7 | 90,299 | -70.4 |
| 4. Animal and vegetable oils and fats | 16 | 0.0 | 64 | -75.7 |
| 5. Chemicals and related products,n.e.s. | 24,510 | 11.6 | 19,752 | 24.1 |
| 6. Basic manufactures | 32,820 | 15.6 | 29,819 | 10.1 |
| 7. Machinery,transport equipment | 65,695 | 31.2 | 54,079 | 21.5 |
| 8. Miscellaneous manufactured articles | 22,511 | 10.7 | 21,248 | 5.9 |
| 9. Goods not classified elsewhere | 415 | 0.2 | 137 | 202.9 |
| All groups combined | 210,396 | 100.0 | 253,665 | -17.1 |

| Q2 / 2026 | Q2 / 2025 | Muutos edellisestä vastaavasta kaudesta % | ||
|---|---|---|---|---|
| 1,000 € | % | 1,000 € | ||
| 0. Food and live animals | 12,758 | 11.7 | 15,868 | -19.6 |
| 1. Beverages and tobacco | 191 | 0.2 | 165 | 15.5 |
| 2. Crude materials,inedible,except fuels | 27,780 | 25.4 | 31,186 | -10.9 |
| 3. Mineral fuels etc | 2,209 | 2.0 | 57 | .. |
| 4. Animal and vegetable oils and fats | 224 | 0.2 | 2 | .. |
| 5. Chemicals and related products,n.e.s. | 3,872 | 3.5 | 6,289 | -38.4 |
| 6. Basic manufactures | 43,785 | 40.0 | 36,918 | 18.6 |
| 7. Machinery,transport equipment | 7,425 | 6.8 | 9,890 | -24.9 |
| 8. Miscellaneous manufactured articles | 11,124 | 10.2 | 11,865 | -6.2 |
| 9. Goods not classified elsewhere | 25 | 0.0 | 1,210 | -97.9 |
| All groups combined | 109,394 | 100.0 | 113,451 | -3.6 |
| Classification | Description | Year level | Quarter level | Month level | Year 2026 sofar |
|---|---|---|---|---|---|
| SITC | Standard International Trade Classification (classification system is maintained by the United Nations) | ███ | ███ | ███ | ███ |
| BEC | The standard of statistical classification of BEC (Broad Economic Categories) is upheld by the UN and it is based on SITC-nomenclature. | ███ | ███ | ███ | ███ |
| NACE | National industrial classification based on Statistical Classification of Economic Activities in the European Community Nomenclature générale des Activités économiques dans les Communautés européennes | ███ | ███ | ███ | ███ |
| CPA | CPA = Classification of Products by Activities | ███ | ███ | ███ | ███ |
| CN | The Combined Nomenclature is the common nomenclature of the European Community. | ███ | ███ | ███ | ███ |