
| Export of goods from Finland and import to Finland | Trade Balance |

| Import 1,000 € | Export 1,000 € | Trade 1,000 € | Trade Balance 1,000 € | |
|---|---|---|---|---|
| 2019 Q1 | 19,365 | 5,076 | 24,441 | -14,288 |
| 2019 Q2 | 22,648 | 6,249 | 28,897 | -16,399 |
| 2019 Q3 | 20,190 | 4,371 | 24,561 | -15,819 |
| 2019 Q4 | 17,769 | 6,930 | 24,698 | -10,839 |
| 2020 Q1 | 15,768 | 6,576 | 22,345 | -9,192 |
| 2020 Q2 | 17,649 | 6,040 | 23,689 | -11,610 |
| 2020 Q3 | 18,287 | 5,441 | 23,728 | -12,845 |
| 2020 Q4 | 15,256 | 10,051 | 25,307 | -5,205 |
| 2021 Q1 | 16,159 | 10,604 | 26,763 | -5,554 |
| 2021 Q2 | 24,030 | 9,639 | 33,669 | -14,392 |
| 2021 Q3 | 21,202 | 6,315 | 27,518 | -14,887 |
| 2021 Q4 | 31,395 | 10,497 | 41,892 | -20,898 |
| 2022 Q1 | 31,664 | 9,490 | 41,154 | -22,174 |
| 2022 Q2 | 34,739 | 9,518 | 44,257 | -25,221 |
| 2022 Q3 | 33,043 | 12,447 | 45,490 | -20,595 |
| 2022 Q4 | 23,678 | 15,686 | 39,365 | -7,992 |
| 2023 Q1 | 24,637 | 23,613 | 48,251 | -1,024 |
| 2023 Q2 | 23,210 | 19,059 | 42,269 | -4,152 |
| 2023 Q3 | 24,266 | 24,715 | 48,981 | 450 |
| 2023 Q4 | 25,175 | 13,796 | 38,972 | -11,379 |
| 2024 Q1 | 17,530 | 9,723 | 27,253 | -7,806 |
| 2024 Q2 | 21,191 | 9,292 | 30,482 | -11,899 |
| 2024 Q3 | 20,367 | 9,592 | 29,959 | -10,775 |
| 2024 Q4 | 21,998 | 10,598 | 32,596 | -11,400 |
| 2025 Q1 | 26,474 | 11,191 | 37,665 | -15,284 |
| 2025 Q2 | 14,916 | 14,875 | 29,792 | -41 |
| 2025 Q3 | 20,288 | 13,138 | 33,426 | -7,151 |
| 2025 Q4 | 17,764 | 11,839 | 29,603 | -5,925 |
| 2026 Q1 | 11,128 | 16,075 | 27,203 | 4,947 |
| 2026 Q2 | 13,812 | 20,191 | 34,003 | 6,379 |
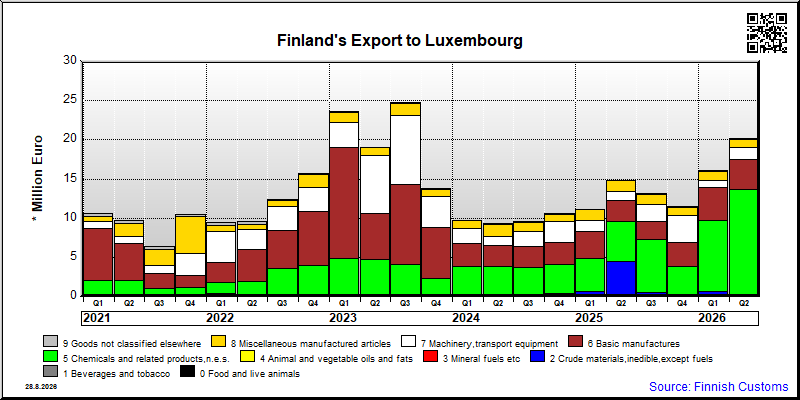
| Q2 / 2026 | Q2 / 2025 | Muutos edellisestä vastaavasta kaudesta % | ||
|---|---|---|---|---|
| 1,000 € | % | 1,000 € | ||
| 0. Food and live animals | 3 | 0.0 | 8 | -62.1 |
| 1. Beverages and tobacco | 36 | 0.2 | 0 | .. |
| 2. Crude materials,inedible,except fuels | 243 | 1.2 | 4,505 | -94.6 |
| 3. Mineral fuels etc | 0 | 0 | 16 | .. |
| 5. Chemicals and related products,n.e.s. | 13,378 | 66.3 | 5,022 | 166.4 |
| 6. Basic manufactures | 3,839 | 19.0 | 2,688 | 42.8 |
| 7. Machinery,transport equipment | 1,508 | 7.5 | 1,107 | 36.2 |
| 8. Miscellaneous manufactured articles | 1,090 | 5.4 | 1,438 | -24.2 |
| 9. Goods not classified elsewhere | 93 | 0.5 | 65 | 44.8 |
| All groups combined | 20,191 | 100.0 | 14,849 | 36.0 |
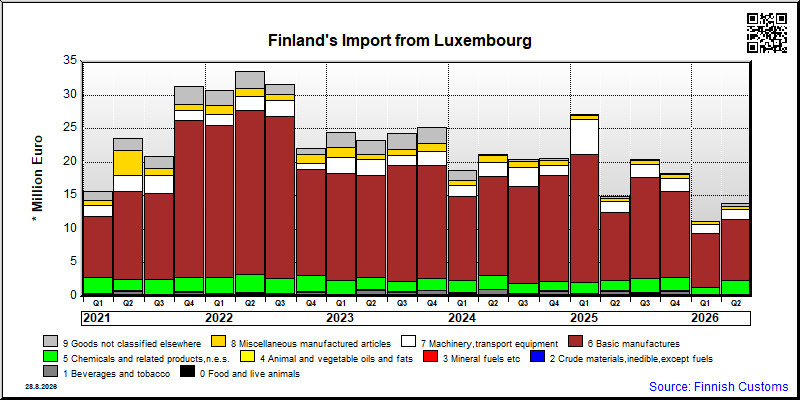
| Q2 / 2026 | Q2 / 2025 | Muutos edellisestä vastaavasta kaudesta % | ||
|---|---|---|---|---|
| 1,000 € | % | 1,000 € | ||
| 0. Food and live animals | 45 | 0.3 | 131 | -65.8 |
| 1. Beverages and tobacco | 20 | 0.1 | 624 | -96.8 |
| 2. Crude materials,inedible,except fuels | 0 | 0 | 181 | .. |
| 3. Mineral fuels etc | 0 | 0.0 | 0 | .. |
| 5. Chemicals and related products,n.e.s. | 2,253 | 16.3 | 1,519 | 48.3 |
| 6. Basic manufactures | 9,161 | 66.3 | 10,065 | -9.0 |
| 7. Machinery,transport equipment | 1,463 | 10.6 | 1,556 | -6.0 |
| 8. Miscellaneous manufactured articles | 447 | 3.2 | 591 | -24.3 |
| 9. Goods not classified elsewhere | 423 | 3.1 | 268 | 58.1 |
| All groups combined | 13,812 | 100.0 | 14,935 | -7.5 |
| Classification | Description | Year level | Quarter level | Month level | Year 2026 sofar |
|---|---|---|---|---|---|
| SITC | Standard International Trade Classification (classification system is maintained by the United Nations) | ███ | ███ | ███ | ███ |
| BEC | The standard of statistical classification of BEC (Broad Economic Categories) is upheld by the UN and it is based on SITC-nomenclature. | ███ | ███ | ███ | ███ |
| NACE | National industrial classification based on Statistical Classification of Economic Activities in the European Community Nomenclature générale des Activités économiques dans les Communautés européennes | ███ | ███ | ███ | ███ |
| CPA | CPA = Classification of Products by Activities | ███ | ███ | ███ | ███ |
| CN | The Combined Nomenclature is the common nomenclature of the European Community. | ███ | ███ | ███ | ███ |