
| Export of goods from Finland and import to Finland | Trade Balance |

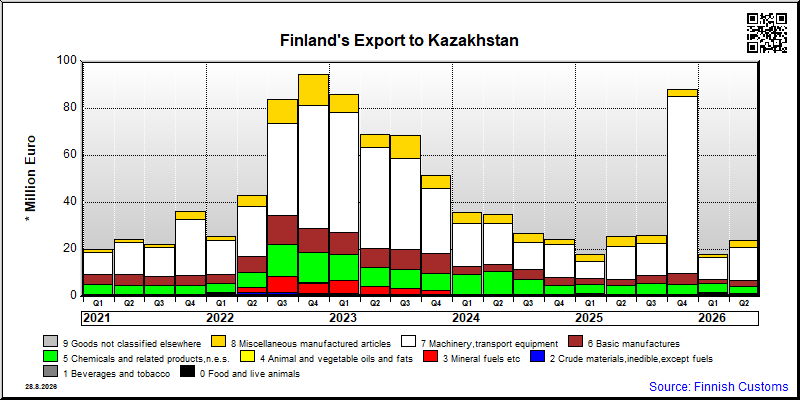
| Import 1,000 € | Export 1,000 € | Trade 1,000 € | Trade Balance 1,000 € | |
|---|---|---|---|---|
| 2019 Q1 | 2,581 | 26,942 | 29,523 | 24,361 |
| 2019 Q2 | 3,320 | 42,409 | 45,729 | 39,089 |
| 2019 Q3 | 4,034 | 26,247 | 30,281 | 22,213 |
| 2019 Q4 | 629 | 44,048 | 44,677 | 43,419 |
| 2020 Q1 | 1,395 | 23,763 | 25,158 | 22,369 |
| 2020 Q2 | 418 | 19,553 | 19,971 | 19,135 |
| 2020 Q3 | 520 | 17,620 | 18,140 | 17,100 |
| 2020 Q4 | 625 | 18,452 | 19,076 | 17,827 |
| 2021 Q1 | 644 | 19,434 | 20,078 | 18,790 |
| 2021 Q2 | 1,689 | 24,465 | 26,153 | 22,776 |
| 2021 Q3 | 1,781 | 22,329 | 24,110 | 20,548 |
| 2021 Q4 | 3,983 | 36,127 | 40,110 | 32,144 |
| 2022 Q1 | 1,843 | 25,523 | 27,366 | 23,680 |
| 2022 Q2 | 39,152 | 42,905 | 82,057 | 3,752 |
| 2022 Q3 | 75,843 | 84,009 | 159,852 | 8,165 |
| 2022 Q4 | 69,997 | 94,531 | 164,527 | 24,534 |
| 2023 Q1 | 1,562 | 85,883 | 87,445 | 84,321 |
| 2023 Q2 | 2,484 | 69,111 | 71,595 | 66,626 |
| 2023 Q3 | 1,236 | 68,680 | 69,916 | 67,444 |
| 2023 Q4 | 3,262 | 51,325 | 54,587 | 48,063 |
| 2024 Q1 | 8,090 | 35,870 | 43,959 | 27,780 |
| 2024 Q2 | 3,451 | 34,978 | 38,428 | 31,527 |
| 2024 Q3 | 575 | 26,813 | 27,388 | 26,237 |
| 2024 Q4 | 7,079 | 24,361 | 31,440 | 17,281 |
| 2025 Q1 | 1,765 | 17,955 | 19,720 | 16,190 |
| 2025 Q2 | 5,439 | 26,081 | 31,520 | 20,642 |
| 2025 Q3 | 5,627 | 26,256 | 31,883 | 20,629 |
| 2025 Q4 | 8,152 | 87,675 | 95,827 | 79,523 |
| 2026 Q1 | 8,670 | 17,918 | 26,588 | 9,248 |
| 2026 Q2 | 34,196 | 24,034 | 58,230 | -10,162 |
| Q2 / 2026 | Q2 / 2025 | Muutos edellisestä vastaavasta kaudesta % | ||
|---|---|---|---|---|
| 1,000 € | % | 1,000 € | ||
| 0. Food and live animals | 1,023 | 4.3 | 602 | 70.0 |
| 1. Beverages and tobacco | 57 | 0.2 | 57 | 0.7 |
| 2. Crude materials,inedible,except fuels | 23 | 0.1 | 8 | 188.4 |
| 3. Mineral fuels etc | 7 | 0.0 | 8 | -16.8 |
| 4. Animal and vegetable oils and fats | 0 | 0 | 0 | .. |
| 5. Chemicals and related products,n.e.s. | 2,977 | 12.4 | 4,021 | -26.0 |
| 6. Basic manufactures | 2,617 | 10.9 | 2,348 | 11.5 |
| 7. Machinery,transport equipment | 13,996 | 58.2 | 14,360 | -2.5 |
| 8. Miscellaneous manufactured articles | 3,333 | 13.9 | 4,251 | -21.6 |
| All groups combined | 24,034 | 100.0 | 25,654 | -6.3 |

| Q2 / 2026 | Q2 / 2025 | Muutos edellisestä vastaavasta kaudesta % | ||
|---|---|---|---|---|
| 1,000 € | % | 1,000 € | ||
| 0. Food and live animals | 801 | 2.3 | 1,294 | -38.1 |
| 2. Crude materials,inedible,except fuels | 31,326 | 91.6 | 3,386 | 825.3 |
| 5. Chemicals and related products,n.e.s. | 8 | 0.0 | 21 | -61.2 |
| 6. Basic manufactures | 1,072 | 3.1 | 228 | 370.2 |
| 7. Machinery,transport equipment | 438 | 1.3 | 439 | -0.3 |
| 8. Miscellaneous manufactured articles | 548 | 1.6 | 69 | 700.4 |
| 9. Goods not classified elsewhere | 3 | 0.0 | 4 | -5.4 |
| All groups combined | 34,196 | 100.0 | 5,439 | 528.7 |
| Classification | Description | Year level | Quarter level | Month level | Year 2026 sofar |
|---|---|---|---|---|---|
| SITC | Standard International Trade Classification (classification system is maintained by the United Nations) | ███ | ███ | ███ | ███ |
| BEC | The standard of statistical classification of BEC (Broad Economic Categories) is upheld by the UN and it is based on SITC-nomenclature. | ███ | ███ | ███ | ███ |
| NACE | National industrial classification based on Statistical Classification of Economic Activities in the European Community Nomenclature générale des Activités économiques dans les Communautés européennes | ███ | ███ | ███ | ███ |
| CPA | CPA = Classification of Products by Activities | ███ | ███ | ███ | ███ |
| CN | The Combined Nomenclature is the common nomenclature of the European Community. | ███ | ███ | ███ | ███ |