
| Export of goods from Finland and import to Finland | Trade Balance |
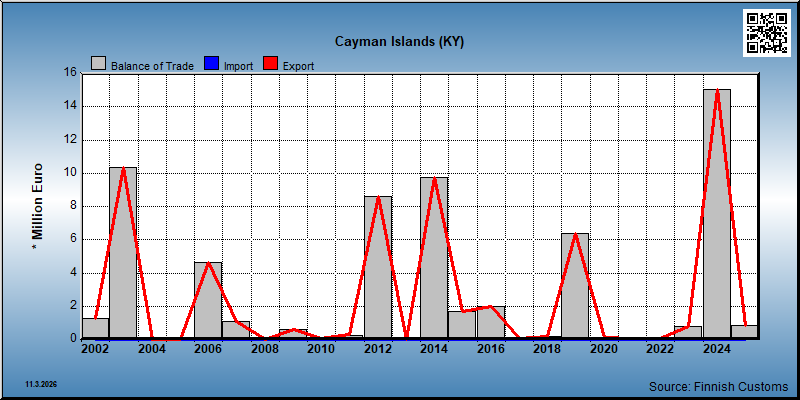
| Year | Import 1,000 € | Export 1,000 € | Trade 1,000 € | Trade balance 1,000 € |
|---|---|---|---|---|
| 2002 | 3 | 1,289 | 1,292 | 1,286 |
| 2003 | 0 | 10,335 | 10,335 | 10,335 |
| 2004 | 0 | 19 | 19 | 19 |
| 2005 | 0 | 0 | 0 | 0 |
| 2006 | 0 | 4,660 | 4,660 | 4,660 |
| 2007 | 0 | 1,053 | 1,053 | 1,053 |
| 2008 | 8 | 10 | 18 | 1 |
| 2009 | 0 | 609 | 609 | 609 |
| 2010 | 1 | 62 | 63 | 61 |
| 2011 | 7 | 276 | 283 | 269 |
| 2012 | 0 | 8,596 | 8,596 | 8,596 |
| 2013 | 0 | 7 | 7 | 7 |
| 2014 | 0 | 9,735 | 9,735 | 9,735 |
| 2015 | 0 | 1,655 | 1,655 | 1,654 |
| 2016 | 0 | 1,969 | 1,969 | 1,969 |
| 2017 | 0 | 33 | 33 | 33 |
| 2018 | 0 | 165 | 165 | 165 |
| 2019 | 2 | 6,387 | 6,389 | 6,384 |
| 2020 | 0 | 94 | 95 | 94 |
| 2021 | 3 | 59 | 62 | 56 |
| 2022 | 9 | 49 | 58 | 40 |
| 2023 | 0 | 792 | 792 | 792 |
| 2024 | 0 | 15,041 | 15,041 | 15,041 |
| 2025 | 1 | 857 | 858 | 856 |
*) SITC = Standard International Trade Classification (classification system is maintained by the United Nations)
| 2021 | 2022 | 2023 | 2024 | 2025 | ||||||
|---|---|---|---|---|---|---|---|---|---|---|
| 1,000 € | % | 1,000 € | % | 1,000 € | % | 1,000 € | % | 1,000 € | % | |
| 5. Chemicals and related products,n.e.s. | 1 | 3.0 | 23 | 3.0 | 1 | 0.0 | ||||
| 54. Medicinal and pharmaceutical products | 1 | 2.8 | ||||||||
| 58. Plastics in non-primary forms | 23 | 2.9 | 1 | 0.0 | ||||||
| 6. Basic manufactures | 1 | 1.0 | 3 | 7.1 | 162 | 20.5 | 2 | 0.0 | 7 | 0.8 |
| 62. Rubber manufactures,n.e.s. | 3 | 6.4 | 1 | 0.1 | 1 | 0.0 | ||||
| 65. Textile yarn,fabrics,made up articles,etc. | 1 | 0.0 | ||||||||
| 69. Manufactures of metals,n.e.s. | 160 | 20.3 | 7 | 0.8 | ||||||
| 7. Machinery,transport equipment | 33 | 55.8 | 28 | 64.7 | 550 | 69.6 | 14,605 | 99.8 | 800 | 93.3 |
| 71. Power generating machinery and equipment | 1 | 2.4 | 57 | 7.2 | 17 | 0.1 | 712 | 83.1 | ||
| 72. Machinery for specialized industries | 6 | 10.1 | 3 | 6.1 | 1 | 0.2 | 7 | 0.0 | 6 | 0.7 |
| 74. General industrial machinery n.e.s. | 6 | 9.7 | 7 | 16.7 | 30 | 3.7 | 78 | 0.5 | 12 | 1.4 |
| 75. Office machines and adp machines | 16 | 2.0 | 1 | 0.0 | 12 | 1.4 | ||||
| 76. Telecommunications and sound recording equipment | 8 | 18.3 | 16 | 0.1 | 9 | 1.0 | ||||
| 77. Electric machinery,n.e.s.and parts | 20 | 33.2 | 6 | 13.7 | 446 | 56.5 | 60 | 0.4 | 49 | 5.7 |
| 78. Road vehicles | 4 | 9.8 | ||||||||
| 79. Other transport equipment | 14,426 | 98.6 | ||||||||
| 8. Miscellaneous manufactured articles | 25 | 42.9 | 11 | 24.9 | 55 | 6.9 | 20 | 0.1 | 50 | 5.8 |
| 81. Prefabr.buildings;sanitary,lighting etc.fixtrs | 1 | 0.1 | ||||||||
| 82. Furniture and parts thereof | 1 | 0.0 | ||||||||
| 84. Articles of apparel and clothing accessories | 4 | 0.4 | ||||||||
| 85. Footwear | 1 | 0.1 | ||||||||
| 87. Instruments and apparates n.e.s. | 23 | 39.2 | 10 | 22.6 | 44 | 5.6 | 17 | 0.1 | 44 | 5.1 |
| 88. Photographic equipment,optical goods etc. | 1 | 1.2 | 1 | 1.7 | 1 | 0.1 | 1 | 0.1 | ||
| 89. Miscellaneous manufactured articles,n.e.s. | 1 | 2.5 | 6 | 0.8 | 1 | 0.0 | 7 | 0.8 | ||
| All groups combined | 59 | 100.0 | 44 | 100.0 | 789 | 100.0 | 14,627 | 100.0 | 857 | 100.0 |
| 2021 | 2022 | 2023 | 2024 | 2025 | ||||||
|---|---|---|---|---|---|---|---|---|---|---|
| 1,000 € | % | 1,000 € | % | 1,000 € | % | 1,000 € | % | 1,000 € | % | |
| 0. Food and live animals | 3 | 97.7 | ||||||||
| 05. Vegetables and fruit | 3 | 97.7 | ||||||||
| 7. Machinery,transport equipment | 1 | 47.9 | ||||||||
| 8. Miscellaneous manufactured articles | 1 | 52.1 | ||||||||
| 87. Instruments and apparates n.e.s. | 1 | 52.1 | ||||||||
| 89. Miscellaneous manufactured articles,n.e.s. | 4 | 5,028.8 | ||||||||
| All groups combined | 3 | 100.0 | 1 | 100.0 | ||||||
| Classification | Description | Year level | Quarter level | Month level | |
|---|---|---|---|---|---|
| SITC | Standard International Trade Classification (classification system is maintained by the United Nations) | ||||
| BEC | The standard of statistical classification of BEC (Broad Economic Categories) is upheld by the UN and it is based on SITC-nomenclature. | ||||
| NACE | National industrial classification based on Statistical Classification of Economic Activities in the European Community Nomenclature générale des Activités économiques dans les Communautés européennes | ||||
| CPA | CPA = Classification of Products by Activities | ||||
| CN | The Combined Nomenclature is the common nomenclature of the European Community. |