
| Export of goods from Finland and import to Finland | Trade Balance |

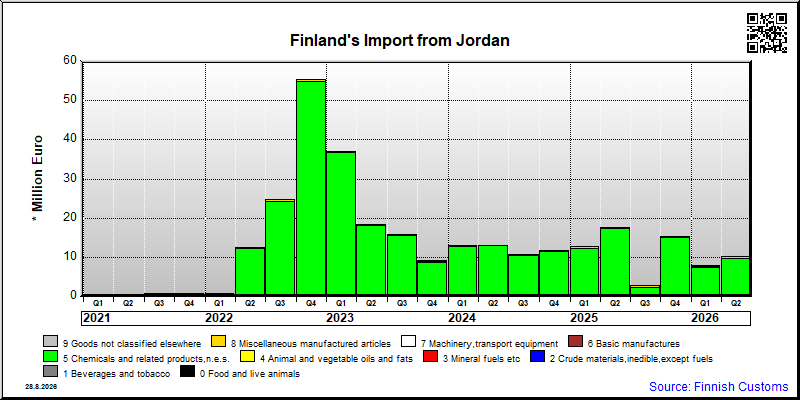
| Import 1,000 € | Export 1,000 € | Trade 1,000 € | Trade Balance 1,000 € | |
|---|---|---|---|---|
| 2019 Q1 | 246 | 23,419 | 23,666 | 23,173 |
| 2019 Q2 | 416 | 12,654 | 13,070 | 12,238 |
| 2019 Q3 | 293 | 6,567 | 6,860 | 6,274 |
| 2019 Q4 | 440 | 5,361 | 5,801 | 4,922 |
| 2020 Q1 | 682 | 6,219 | 6,901 | 5,537 |
| 2020 Q2 | 155 | 8,065 | 8,221 | 7,910 |
| 2020 Q3 | 537 | 7,202 | 7,739 | 6,664 |
| 2020 Q4 | 254 | 9,276 | 9,530 | 9,021 |
| 2021 Q1 | 518 | 6,432 | 6,950 | 5,914 |
| 2021 Q2 | 434 | 6,406 | 6,840 | 5,972 |
| 2021 Q3 | 785 | 7,581 | 8,366 | 6,797 |
| 2021 Q4 | 702 | 12,002 | 12,703 | 11,300 |
| 2022 Q1 | 768 | 8,748 | 9,516 | 7,980 |
| 2022 Q2 | 12,549 | 10,585 | 23,133 | -1,964 |
| 2022 Q3 | 24,665 | 13,628 | 38,293 | -11,037 |
| 2022 Q4 | 55,399 | 11,179 | 66,577 | -44,220 |
| 2023 Q1 | 37,101 | 9,429 | 46,530 | -27,673 |
| 2023 Q2 | 18,369 | 8,630 | 26,998 | -9,739 |
| 2023 Q3 | 15,836 | 6,754 | 22,590 | -9,082 |
| 2023 Q4 | 9,091 | 8,361 | 17,453 | -730 |
| 2024 Q1 | 13,115 | 10,056 | 23,171 | -3,059 |
| 2024 Q2 | 13,127 | 15,088 | 28,215 | 1,961 |
| 2024 Q3 | 10,845 | 10,161 | 21,006 | -685 |
| 2024 Q4 | 11,832 | 8,506 | 20,338 | -3,326 |
| 2025 Q1 | 12,775 | 12,693 | 25,468 | -82 |
| 2025 Q2 | 17,611 | 10,318 | 27,929 | -7,292 |
| 2025 Q3 | 2,709 | 9,295 | 12,004 | 6,586 |
| 2025 Q4 | 15,294 | 8,525 | 23,819 | -6,769 |
| 2026 Q1 | 7,789 | 6,858 | 14,646 | -931 |
| 2026 Q2 | 10,191 | 11,710 | 21,901 | 1,520 |

| Q2 / 2026 | Q2 / 2025 | Muutos edellisestä vastaavasta kaudesta % | ||
|---|---|---|---|---|
| 1,000 € | % | 1,000 € | ||
| 0. Food and live animals | 0 | 0 | 0 | .. |
| 2. Crude materials,inedible,except fuels | 1,745 | 14.9 | 4,606 | -62.1 |
| 5. Chemicals and related products,n.e.s. | 708 | 6.0 | 833 | -15.1 |
| 6. Basic manufactures | 6,849 | 58.5 | 2,391 | 186.5 |
| 7. Machinery,transport equipment | 1,260 | 10.8 | 1,695 | -25.6 |
| 8. Miscellaneous manufactured articles | 1,149 | 9.8 | 793 | 44.8 |
| All groups combined | 11,710 | 100.0 | 10,318 | 13.5 |
| Q2 / 2026 | Q2 / 2025 | Muutos edellisestä vastaavasta kaudesta % | ||
|---|---|---|---|---|
| 1,000 € | % | 1,000 € | ||
| 0. Food and live animals | 105 | 1.0 | 84 | 25.5 |
| 1. Beverages and tobacco | 0 | 0.0 | 0 | .. |
| 4. Animal and vegetable oils and fats | 0 | 0 | 6 | .. |
| 5. Chemicals and related products,n.e.s. | 9,704 | 95.2 | 17,270 | -43.8 |
| 6. Basic manufactures | 5 | 0.1 | 2 | 199.9 |
| 7. Machinery,transport equipment | 2 | 0.0 | 2 | 6.1 |
| 8. Miscellaneous manufactured articles | 372 | 3.6 | 246 | 51.1 |
| 9. Goods not classified elsewhere | 2 | 0.0 | 1 | 139.5 |
| All groups combined | 10,191 | 100.0 | 17,611 | -42.1 |
| Classification | Description | Year level | Quarter level | Month level | Year 2026 sofar |
|---|---|---|---|---|---|
| SITC | Standard International Trade Classification (classification system is maintained by the United Nations) | ███ | ███ | ███ | ███ |
| BEC | The standard of statistical classification of BEC (Broad Economic Categories) is upheld by the UN and it is based on SITC-nomenclature. | ███ | ███ | ███ | ███ |
| NACE | National industrial classification based on Statistical Classification of Economic Activities in the European Community Nomenclature générale des Activités économiques dans les Communautés européennes | ███ | ███ | ███ | ███ |
| CPA | CPA = Classification of Products by Activities | ███ | ███ | ███ | ███ |
| CN | The Combined Nomenclature is the common nomenclature of the European Community. | ███ | ███ | ███ | ███ |