
| Export of goods from Finland and import to Finland | Trade Balance |

| Year | Month | Import 1,000 € | Export 1,000 € | Trade 1,000 € | Trade Balance 1,000 € |
|---|---|---|---|---|---|
| 2023 | 1 | 11,171 | 11,141 | 22,312 | -30 |
| 2023 | 2 | 2,975 | 5,239 | 8,215 | 2,264 |
| 2023 | 3 | 5,837 | 10,359 | 16,195 | 4,522 |
| 2023 | 4 | 16,661 | 8,482 | 25,143 | -8,178 |
| 2023 | 5 | 3,420 | 8,406 | 11,826 | 4,987 |
| 2023 | 6 | 2,803 | 9,837 | 12,640 | 7,034 |
| 2023 | 7 | 7,136 | 6,598 | 13,733 | -538 |
| 2023 | 8 | 3,835 | 7,715 | 11,549 | 3,880 |
| 2023 | 9 | 2,050 | 5,967 | 8,018 | 3,917 |
| 2023 | 10 | 3,702 | 8,410 | 12,112 | 4,708 |
| 2023 | 11 | 3,226 | 9,742 | 12,968 | 6,516 |
| 2023 | 12 | 4,186 | 10,107 | 14,293 | 5,921 |
| 2024 | 1 | 4,274 | 10,568 | 14,843 | 6,294 |
| 2024 | 2 | 3,246 | 7,227 | 10,472 | 3,981 |
| 2024 | 3 | 3,052 | 7,458 | 10,511 | 4,406 |
| 2024 | 4 | 4,203 | 8,030 | 12,233 | 3,827 |
| 2024 | 5 | 2,452 | 7,809 | 10,261 | 5,356 |
| 2024 | 6 | 2,853 | 9,363 | 12,216 | 6,509 |
| 2024 | 7 | 2,943 | 6,090 | 9,033 | 3,147 |
| 2024 | 8 | 2,298 | 6,431 | 8,729 | 4,132 |
| 2024 | 9 | 8,699 | 12,480 | 21,179 | 3,781 |
| 2024 | 10 | 8,611 | 8,003 | 16,614 | -608 |
| 2024 | 11 | 12,128 | 13,441 | 25,569 | 1,314 |
| 2024 | 12 | 1,724 | 10,233 | 11,957 | 8,509 |
| 2025 | 1 | 2,164 | 4,901 | 7,066 | 2,737 |
| 2025 | 2 | 1,573 | 6,609 | 8,182 | 5,036 |
| 2025 | 3 | 2,072 | 11,102 | 13,174 | 9,031 |
| 2025 | 4 | 1,442 | 8,035 | 9,476 | 6,593 |
| 2025 | 5 | 2,104 | 5,231 | 7,335 | 3,127 |
| 2025 | 6 | 1,598 | 12,279 | 13,878 | 10,681 |
| 2025 | 7 | 1,723 | 7,369 | 9,092 | 5,646 |
| 2025 | 8 | 1,548 | 7,436 | 8,984 | 5,887 |
| 2025 | 9 | 2,138 | 13,962 | 16,100 | 11,824 |
| 2025 | 10 | 2,178 | 9,182 | 11,360 | 7,004 |
| 2025 | 11 | 2,633 | 11,653 | 14,287 | 9,020 |
| 2025 | 12 | 3,502 | 8,233 | 11,735 | 4,731 |
| 2026 | 1 | 2,981 | 7,918 | 10,899 | 4,937 |
| 2026 | 2 | 2,163 | 7,242 | 9,405 | 5,079 |
| 2026 | 3 | 1,965 | 8,877 | 10,842 | 6,913 |
| 2026 | 4 | 6,921 | 16,617 | 23,538 | 9,696 |
| 2026 | 5 | 1,819 | 13,903 | 15,722 | 12,084 |
| 2026 | 6 | 1,879 | 11,816 | 13,695 | 9,937 |
| 2026 | 7 | 2,362 | 13,138 | 15,501 | 10,776 |
| 2026 | 8 | 3,453 | 10,640 | 14,093 | 7,188 |

| 2026/4 | 2026/5 | 2026/6 | 2026/7 | 2026/8 | ||||||
|---|---|---|---|---|---|---|---|---|---|---|
| 1000 € | % | 1000 € | % | 1000 € | % | 1000 € | % | 1000 € | % | |
| 0. Food and live animals | 213 | 1.3 | 201 | 1.4 | 282 | 2.4 | 298 | 2.3 | 377 | 3.5 |
| 1. Beverages and tobacco | 3 | 0.0 | 5 | 0.0 | 10 | 0.1 | 10 | 0.1 | 16 | 0.1 |
| 2. Crude materials,inedible,except fuels | 5,486 | 33.0 | 3,315 | 23.8 | 5,308 | 44.9 | 5,075 | 38.6 | 817 | 7.7 |
| 4. Animal and vegetable oils and fats | 8 | 0.1 | ||||||||
| 5. Chemicals and related products,n.e.s. | 139 | 0.8 | 1,299 | 9.3 | 299 | 2.5 | 809 | 6.2 | 188 | 1.8 |
| 6. Basic manufactures | 366 | 2.2 | 1,288 | 9.3 | 257 | 2.2 | 511 | 3.9 | 655 | 6.2 |
| 7. Machinery,transport equipment | 7,877 | 47.4 | 2,626 | 18.9 | 2,689 | 22.8 | 3,476 | 26.5 | 4,906 | 46.1 |
| 8. Miscellaneous manufactured articles | 2,534 | 15.2 | 5,170 | 37.2 | 2,971 | 25.1 | 2,961 | 22.5 | 3,674 | 34.5 |
| All groups combined | 16,617 | 100.0 | 13,903 | 100.0 | 11,816 | 100.0 | 13,138 | 100.0 | 10,640 | 100.0 |
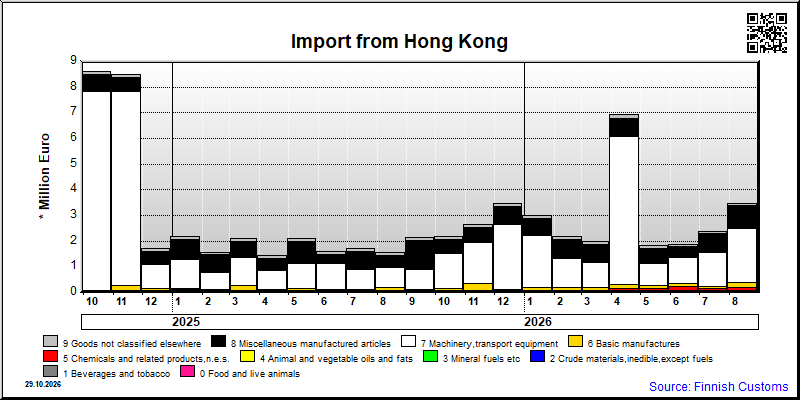
| 2026/4 | 2026/5 | 2026/6 | 2026/7 | 2026/8 | ||||||
|---|---|---|---|---|---|---|---|---|---|---|
| 1000 € | % | 1000 € | % | 1000 € | % | 1000 € | % | 1000 € | % | |
| 0. Food and live animals | 15 | 0.2 | 20 | 1.1 | 58 | 3.1 | 33 | 1.4 | 58 | 1.7 |
| 1. Beverages and tobacco | 1 | 0.0 | 1 | 0.0 | 1 | 0.0 | 1 | 0.0 | ||
| 5. Chemicals and related products,n.e.s. | 143 | 2.1 | 149 | 8.2 | 157 | 8.3 | 119 | 5.0 | 153 | 4.4 |
| 6. Basic manufactures | 138 | 2.0 | 101 | 5.6 | 151 | 8.0 | 72 | 3.0 | 158 | 4.6 |
| 7. Machinery,transport equipment | 5,769 | 83.4 | 879 | 48.3 | 1,007 | 53.6 | 1,335 | 56.5 | 2,129 | 61.7 |
| 8. Miscellaneous manufactured articles | 718 | 10.4 | 560 | 30.8 | 406 | 21.6 | 736 | 31.1 | 888 | 25.7 |
| 9. Goods not classified elsewhere | 137 | 2.0 | 111 | 6.1 | 100 | 5.3 | 68 | 2.9 | 65 | 1.9 |
| All groups combined | 6,921 | 100.0 | 1,819 | 100.0 | 1,879 | 100.0 | 2,362 | 100.0 | 3,453 | 100.0 |
| Classification | Description | Year level | Quarter level | Month level | Year 2026 sofar |
|---|---|---|---|---|---|
| SITC | Standard International Trade Classification (classification system is maintained by the United Nations) | ███ | ███ | ███ | ███ |
| BEC | The standard of statistical classification of BEC (Broad Economic Categories) is upheld by the UN and it is based on SITC-nomenclature. | ███ | ███ | ███ | ███ |
| NACE | National industrial classification based on Statistical Classification of Economic Activities in the European Community Nomenclature générale des Activités économiques dans les Communautés européennes | ███ | ███ | ███ | ███ |
| CPA | CPA = Classification of Products by Activities | ███ | ███ | ███ | ███ |
| CN | The Combined Nomenclature is the common nomenclature of the European Community. | ███ | ███ | ███ | ███ |