
| Export of goods from Finland and import to Finland | Trade Balance |

| Import 1,000 € | Export 1,000 € | Trade 1,000 € | Trade Balance 1,000 € | |
|---|---|---|---|---|
| 2019 Q1 | 772,735 | 1,478,005 | 2,250,740 | 705,270 |
| 2019 Q2 | 883,189 | 1,501,695 | 2,384,884 | 618,506 |
| 2019 Q3 | 848,913 | 1,386,046 | 2,234,960 | 537,133 |
| 2019 Q4 | 851,029 | 1,448,143 | 2,299,172 | 597,114 |
| 2020 Q1 | 805,872 | 1,303,584 | 2,109,456 | 497,712 |
| 2020 Q2 | 711,613 | 1,093,233 | 1,804,846 | 381,621 |
| 2020 Q3 | 685,305 | 1,189,577 | 1,874,882 | 504,271 |
| 2020 Q4 | 822,180 | 2,250,993 | 3,073,173 | 1,428,814 |
| 2021 Q1 | 734,762 | 1,388,768 | 2,123,529 | 654,006 |
| 2021 Q2 | 881,118 | 1,360,466 | 2,241,584 | 479,348 |
| 2021 Q3 | 936,273 | 1,434,989 | 2,371,262 | 498,716 |
| 2021 Q4 | 856,623 | 1,735,306 | 2,591,929 | 878,683 |
| 2022 Q1 | 854,088 | 1,683,382 | 2,537,470 | 829,294 |
| 2022 Q2 | 1,193,444 | 2,035,259 | 3,228,703 | 841,815 |
| 2022 Q3 | 1,617,757 | 2,456,896 | 4,074,653 | 839,140 |
| 2022 Q4 | 1,802,251 | 3,402,897 | 5,205,147 | 1,600,646 |
| 2023 Q1 | 1,186,436 | 1,908,053 | 3,094,489 | 721,617 |
| 2023 Q2 | 1,506,002 | 2,162,006 | 3,668,008 | 656,004 |
| 2023 Q3 | 1,250,642 | 2,190,417 | 3,441,059 | 939,776 |
| 2023 Q4 | 1,275,912 | 3,960,599 | 5,236,511 | 2,684,687 |
| 2024 Q1 | 1,192,443 | 1,819,987 | 3,012,430 | 627,544 |
| 2024 Q2 | 1,121,692 | 2,229,350 | 3,351,042 | 1,107,658 |
| 2024 Q3 | 1,416,126 | 2,248,485 | 3,664,612 | 832,359 |
| 2024 Q4 | 1,190,185 | 2,256,062 | 3,446,247 | 1,065,876 |
| 2025 Q1 | 1,075,476 | 1,768,937 | 2,844,413 | 693,461 |
| 2025 Q2 | 1,381,061 | 1,900,752 | 3,281,813 | 519,691 |
| 2025 Q3 | 1,754,429 | 3,295,663 | 5,050,092 | 1,541,235 |
| 2025 Q4 | 1,389,373 | 2,089,486 | 3,478,859 | 700,113 |
| 2026 Q1 | 1,947,602 | 2,192,457 | 4,140,059 | 244,855 |
| 2026 Q2 | 1,751,058 | 4,542,083 | 6,293,140 | 2,791,025 |
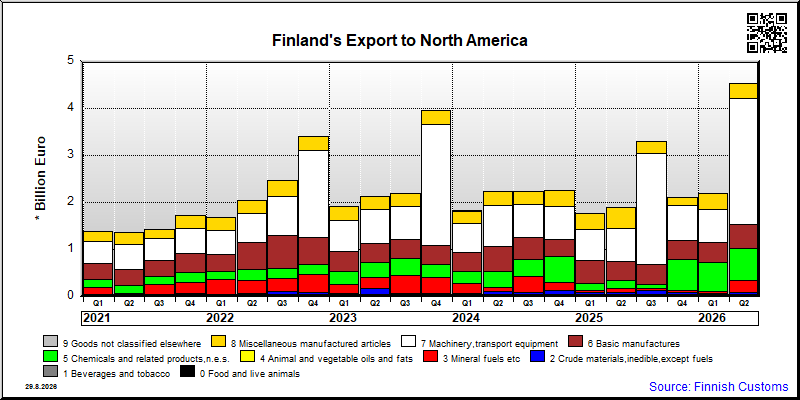
| Q2 / 2026 | Q2 / 2025 | Muutos edellisestä vastaavasta kaudesta % | ||
|---|---|---|---|---|
| 1,000 € | % | 1,000 € | ||
| 0. Food and live animals | 7,994 | 0.2 | 7,001 | 14.2 |
| 1. Beverages and tobacco | 1,479 | 0.0 | 1,771 | -16.5 |
| 2. Crude materials,inedible,except fuels | 81,509 | 1.8 | 82,985 | -1.8 |
| 3. Mineral fuels etc | 253,490 | 5.6 | 72,899 | 247.7 |
| 4. Animal and vegetable oils and fats | 71 | 0.0 | 50 | 41.6 |
| 5. Chemicals and related products,n.e.s. | 683,980 | 15.1 | 165,376 | 313.6 |
| 6. Basic manufactures | 505,075 | 11.1 | 417,242 | 21.1 |
| 7. Machinery,transport equipment | 2,671,311 | 58.8 | 693,352 | 285.3 |
| 8. Miscellaneous manufactured articles | 337,168 | 7.4 | 447,108 | -24.6 |
| 9. Goods not classified elsewhere | 5 | 0.0 | 459 | -99.0 |
| All groups combined | 4,542,083 | 100.0 | 1,888,215 | 140.5 |
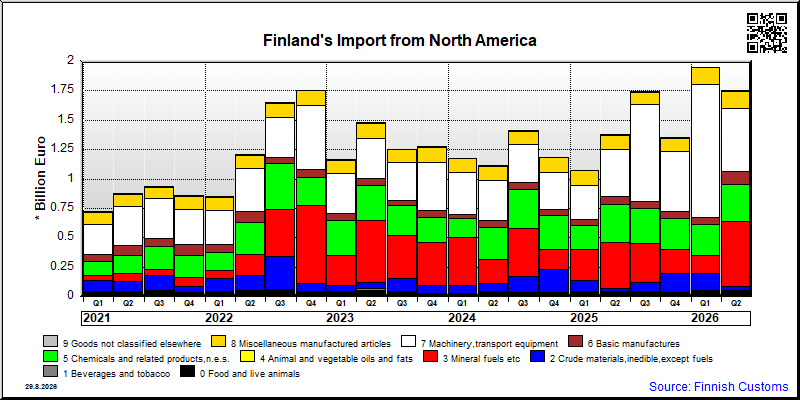
| Q2 / 2026 | Q2 / 2025 | Muutos edellisestä vastaavasta kaudesta % | ||
|---|---|---|---|---|
| 1,000 € | % | 1,000 € | ||
| 0. Food and live animals | 46,577 | 2.7 | 36,321 | 28.2 |
| 1. Beverages and tobacco | 5,040 | 0.3 | 5,730 | -12.0 |
| 2. Crude materials,inedible,except fuels | 31,941 | 1.8 | 25,123 | 27.1 |
| 3. Mineral fuels etc | 554,274 | 31.7 | 388,496 | 42.7 |
| 4. Animal and vegetable oils and fats | 1,008 | 0.1 | 156 | 545.0 |
| 5. Chemicals and related products,n.e.s. | 314,898 | 18.0 | 326,380 | -3.5 |
| 6. Basic manufactures | 113,127 | 6.5 | 65,793 | 71.9 |
| 7. Machinery,transport equipment | 531,211 | 30.3 | 407,309 | 30.4 |
| 8. Miscellaneous manufactured articles | 149,722 | 8.6 | 115,937 | 29.1 |
| 9. Goods not classified elsewhere | 3,263 | 0.2 | 3,796 | -14.1 |
| All groups combined | 1,751,058 | 100.0 | 1,374,990 | 27.4 |
| Classification | Description | Year level | Quarter level | Month level | Year 2026 sofar |
|---|---|---|---|---|---|
| SITC | Standard International Trade Classification (classification system is maintained by the United Nations) | ███ | ███ | ███ | ███ |
| BEC | The standard of statistical classification of BEC (Broad Economic Categories) is upheld by the UN and it is based on SITC-nomenclature. | ███ | ███ | ███ | ███ |
| NACE | National industrial classification based on Statistical Classification of Economic Activities in the European Community Nomenclature générale des Activités économiques dans les Communautés européennes | ███ | ███ | ███ | ███ |
| CPA | CPA = Classification of Products by Activities | ███ | ███ | ███ | ███ |
| CN | The Combined Nomenclature is the common nomenclature of the European Community. | ███ | ███ | ███ | ███ |