
| Export of goods from Finland and import to Finland | Trade Balance |

| Import 1,000 € | Export 1,000 € | Trade 1,000 € | Trade Balance 1,000 € | |
|---|---|---|---|---|
| 2019 Q1 | 2,110 | 3,852 | 5,962 | 1,742 |
| 2019 Q2 | 2,317 | 3,735 | 6,052 | 1,418 |
| 2019 Q3 | 6,689 | 129,256 | 135,945 | 122,567 |
| 2019 Q4 | 1,759 | 5,729 | 7,489 | 3,970 |
| 2020 Q1 | 2,713 | 4,392 | 7,105 | 1,679 |
| 2020 Q2 | 4,143 | 3,314 | 7,457 | -829 |
| 2020 Q3 | 4,145 | 4,983 | 9,129 | 838 |
| 2020 Q4 | 2,577 | 4,688 | 7,265 | 2,111 |
| 2021 Q1 | 3,037 | 3,507 | 6,544 | 470 |
| 2021 Q2 | 4,270 | 7,430 | 11,700 | 3,160 |
| 2021 Q3 | 5,153 | 5,242 | 10,395 | 89 |
| 2021 Q4 | 1,317 | 3,798 | 5,115 | 2,481 |
| 2022 Q1 | 1,843 | 9,254 | 11,097 | 7,410 |
| 2022 Q2 | 4,295 | 9,910 | 14,205 | 5,615 |
| 2022 Q3 | 4,656 | 4,668 | 9,323 | 12 |
| 2022 Q4 | 2,909 | 5,711 | 8,620 | 2,802 |
| 2023 Q1 | 2,696 | 5,063 | 7,759 | 2,366 |
| 2023 Q2 | 5,908 | 5,091 | 10,999 | -816 |
| 2023 Q3 | 4,417 | 4,778 | 9,195 | 360 |
| 2023 Q4 | 2,695 | 4,603 | 7,298 | 1,908 |
| 2024 Q1 | 10,991 | 5,951 | 16,942 | -5,040 |
| 2024 Q2 | 6,196 | 5,978 | 12,174 | -218 |
| 2024 Q3 | 4,041 | 5,259 | 9,300 | 1,218 |
| 2024 Q4 | 3,600 | 11,232 | 14,831 | 7,632 |
| 2025 Q1 | 2,760 | 4,435 | 7,195 | 1,674 |
| 2025 Q2 | 6,303 | 5,215 | 11,518 | -1,088 |
| 2025 Q3 | 4,182 | 5,366 | 9,548 | 1,185 |
| 2025 Q4 | 11,395 | 5,347 | 16,742 | -6,048 |
| 2026 Q1 | 5,424 | 5,764 | 11,189 | 340 |
| 2026 Q2 | 5,905 | 4,899 | 10,804 | -1,007 |
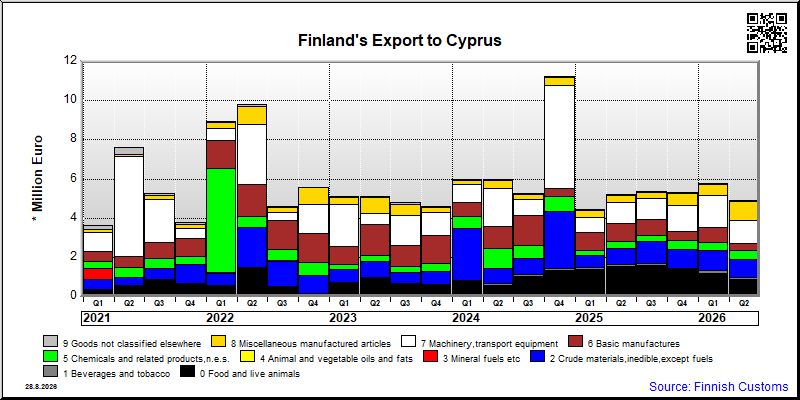
| Q2 / 2026 | Q2 / 2025 | Muutos edellisestä vastaavasta kaudesta % | ||
|---|---|---|---|---|
| 1,000 € | % | 1,000 € | ||
| 0. Food and live animals | 846 | 17.3 | 1,519 | -44.3 |
| 1. Beverages and tobacco | 142 | 2.9 | 128 | 10.8 |
| 2. Crude materials,inedible,except fuels | 910 | 18.6 | 824 | 10.4 |
| 3. Mineral fuels etc | 0 | 0.0 | 0 | 8.0 |
| 5. Chemicals and related products,n.e.s. | 469 | 9.6 | 326 | 43.7 |
| 6. Basic manufactures | 318 | 6.5 | 929 | -65.8 |
| 7. Machinery,transport equipment | 1,196 | 24.4 | 1,066 | 12.2 |
| 8. Miscellaneous manufactured articles | 954 | 19.5 | 378 | 152.6 |
| 9. Goods not classified elsewhere | 64 | 1.3 | 47 | 37.6 |
| All groups combined | 4,899 | 100.0 | 5,217 | -6.1 |
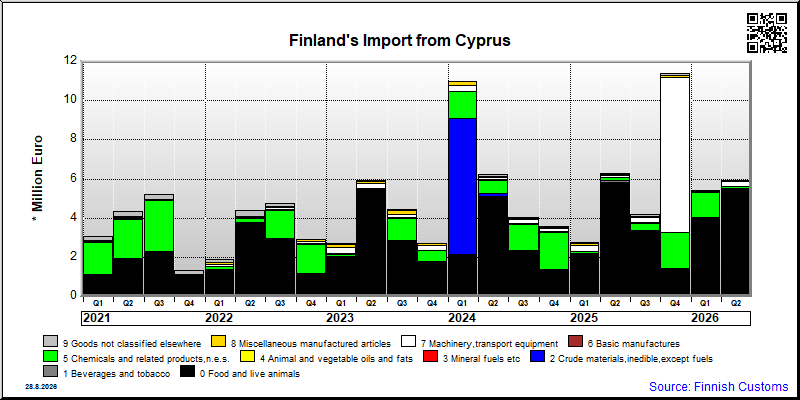
| Q2 / 2026 | Q2 / 2025 | Muutos edellisestä vastaavasta kaudesta % | ||
|---|---|---|---|---|
| 1,000 € | % | 1,000 € | ||
| 0. Food and live animals | 5,434 | 92.0 | 5,831 | -6.8 |
| 1. Beverages and tobacco | 39 | 0.7 | 68 | -43.0 |
| 2. Crude materials,inedible,except fuels | 33 | 0.6 | 4 | 709.3 |
| 5. Chemicals and related products,n.e.s. | 124 | 2.1 | 151 | -18.0 |
| 6. Basic manufactures | 2 | 0.0 | 17 | -90.2 |
| 7. Machinery,transport equipment | 265 | 4.5 | 84 | 213.5 |
| 8. Miscellaneous manufactured articles | 10 | 0.2 | 82 | -88.4 |
| 9. Goods not classified elsewhere | 0 | 0 | 63 | .. |
| All groups combined | 5,905 | 100.0 | 6,301 | -6.3 |
| Classification | Description | Year level | Quarter level | Month level | Year 2026 sofar |
|---|---|---|---|---|---|
| SITC | Standard International Trade Classification (classification system is maintained by the United Nations) | ███ | ███ | ███ | ███ |
| BEC | The standard of statistical classification of BEC (Broad Economic Categories) is upheld by the UN and it is based on SITC-nomenclature. | ███ | ███ | ███ | ███ |
| NACE | National industrial classification based on Statistical Classification of Economic Activities in the European Community Nomenclature générale des Activités économiques dans les Communautés européennes | ███ | ███ | ███ | ███ |
| CPA | CPA = Classification of Products by Activities | ███ | ███ | ███ | ███ |
| CN | The Combined Nomenclature is the common nomenclature of the European Community. | ███ | ███ | ███ | ███ |