
| Export of goods from Finland and import to Finland | Trade Balance |
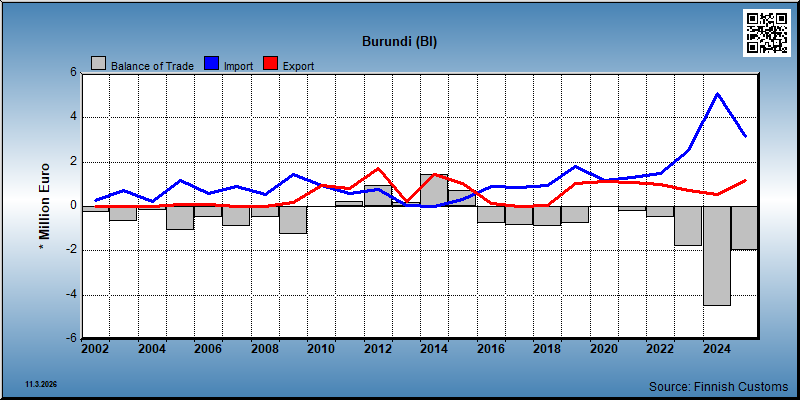
| Year | Import 1,000 € | Export 1,000 € | Trade 1,000 € | Trade balance 1,000 € |
|---|---|---|---|---|
| 2002 | 269 | 10 | 279 | -260 |
| 2003 | 705 | 18 | 724 | -687 |
| 2004 | 211 | 18 | 230 | -193 |
| 2005 | 1,187 | 90 | 1,277 | -1,097 |
| 2006 | 569 | 74 | 643 | -495 |
| 2007 | 915 | 8 | 923 | -907 |
| 2008 | 528 | 22 | 550 | -506 |
| 2009 | 1,441 | 164 | 1,605 | -1,276 |
| 2010 | 947 | 963 | 1,909 | 16 |
| 2011 | 607 | 823 | 1,430 | 215 |
| 2012 | 746 | 1,709 | 2,455 | 964 |
| 2013 | 59 | 242 | 301 | 183 |
| 2014 | 4 | 1,425 | 1,429 | 1,421 |
| 2015 | 317 | 1,049 | 1,366 | 732 |
| 2016 | 921 | 147 | 1,069 | -774 |
| 2017 | 861 | 19 | 881 | -842 |
| 2018 | 940 | 40 | 980 | -901 |
| 2019 | 1,798 | 1,029 | 2,827 | -769 |
| 2020 | 1,154 | 1,127 | 2,282 | -27 |
| 2021 | 1,319 | 1,087 | 2,406 | -232 |
| 2022 | 1,491 | 1,003 | 2,494 | -489 |
| 2023 | 2,520 | 717 | 3,236 | -1,803 |
| 2024 | 5,090 | 563 | 5,653 | -4,527 |
| 2025 | 3,172 | 1,190 | 4,362 | -1,983 |
*) SITC = Standard International Trade Classification (classification system is maintained by the United Nations)
| 2021 | 2022 | 2023 | 2024 | 2025 | ||||||
|---|---|---|---|---|---|---|---|---|---|---|
| 1,000 € | % | 1,000 € | % | 1,000 € | % | 1,000 € | % | 1,000 € | % | |
| 5. Chemicals and related products,n.e.s. | 735 | 67.6 | 945 | 94.3 | 496 | 69.3 | 728 | 61.2 | ||
| 54. Medicinal and pharmaceutical products | 735 | 67.6 | 904 | 90.3 | 496 | 69.3 | 728 | 61.2 | ||
| 59. Chemical materials and products,n.e.s. | 41 | 4.1 | ||||||||
| 6. Basic manufactures | 13 | 1.8 | ||||||||
| 64. Paper,paperboard and articles thereof | 13 | 1.8 | ||||||||
| 7. Machinery,transport equipment | 27 | 2.5 | 57 | 5.7 | 201 | 28.0 | 41 | 7.3 | ||
| 72. Machinery for specialized industries | 136 | 18.9 | ||||||||
| 74. General industrial machinery n.e.s. | 2 | 0.1 | ||||||||
| 76. Telecommunications and sound recording equipment | 1 | 0.1 | 1 | 0.1 | 2 | 0.2 | ||||
| 78. Road vehicles | 24 | 2.2 | 56 | 5.6 | 64 | 8.9 | 41 | 7.3 | ||
| 8. Miscellaneous manufactured articles | 326 | 30.0 | 6 | 0.9 | 522 | 92.7 | 462 | 38.8 | ||
| 87. Instruments and apparates n.e.s. | 11 | 1.0 | 6 | 0.9 | 462 | 38.8 | ||||
| 89. Miscellaneous manufactured articles,n.e.s. | 315 | 29.0 | 522 | 92.7 | ||||||
| All groups combined | 1,087 | 100.0 | 1,001 | 100.0 | 717 | 100.0 | 563 | 100.0 | 1,190 | 100.0 |
| 2021 | 2022 | 2023 | 2024 | 2025 | ||||||
|---|---|---|---|---|---|---|---|---|---|---|
| 1,000 € | % | 1,000 € | % | 1,000 € | % | 1,000 € | % | 1,000 € | % | |
| 0. Food and live animals | 1,318 | 99.9 | 1,491 | 100.0 | 2,519 | 100.0 | 5,089 | 100.0 | 3,172 | 100.0 |
| 07. Coffee,tea,cocoa,spices | 1,318 | 99.9 | 1,491 | 100.0 | 2,519 | 100.0 | 5,089 | 100.0 | 3,172 | 100.0 |
| 9. Goods not classified elsewhere | 1 | 0.0 | ||||||||
| 93. Special transactions and commodities not classified | 1 | 0.0 | ||||||||
| All groups combined | 1,319 | 100.0 | 1,491 | 100.0 | 2,520 | 100.0 | 5,090 | 100.0 | 3,172 | 100.0 |
| Classification | Description | Year level | Quarter level | Month level | |
|---|---|---|---|---|---|
| SITC | Standard International Trade Classification (classification system is maintained by the United Nations) | ||||
| BEC | The standard of statistical classification of BEC (Broad Economic Categories) is upheld by the UN and it is based on SITC-nomenclature. | ||||
| NACE | National industrial classification based on Statistical Classification of Economic Activities in the European Community Nomenclature générale des Activités économiques dans les Communautés européennes | ||||
| CPA | CPA = Classification of Products by Activities | ||||
| CN | The Combined Nomenclature is the common nomenclature of the European Community. |