
| Export of goods from Finland and import to Finland | Trade Balance |
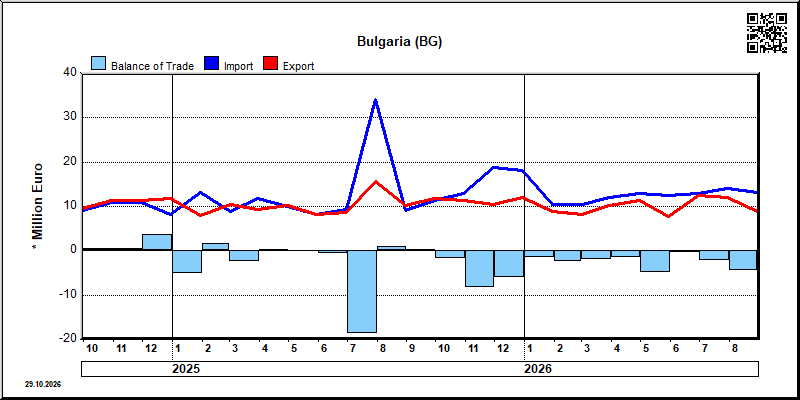
| Year | Month | Import 1,000 € | Export 1,000 € | Trade 1,000 € | Trade Balance 1,000 € |
|---|---|---|---|---|---|
| 2023 | 1 | 9,588 | 10,769 | 20,356 | 1,181 |
| 2023 | 2 | 9,684 | 8,188 | 17,872 | -1,496 |
| 2023 | 3 | 11,447 | 9,136 | 20,583 | -2,311 |
| 2023 | 4 | 8,650 | 16,357 | 25,007 | 7,707 |
| 2023 | 5 | 10,515 | 7,996 | 18,512 | -2,519 |
| 2023 | 6 | 10,177 | 8,727 | 18,904 | -1,450 |
| 2023 | 7 | 6,398 | 8,719 | 15,117 | 2,321 |
| 2023 | 8 | 10,090 | 10,838 | 20,928 | 747 |
| 2023 | 9 | 9,319 | 11,806 | 21,125 | 2,487 |
| 2023 | 10 | 10,431 | 10,185 | 20,616 | -246 |
| 2023 | 11 | 11,077 | 12,298 | 23,375 | 1,221 |
| 2023 | 12 | 8,545 | 8,670 | 17,215 | 125 |
| 2024 | 1 | 9,730 | 11,959 | 21,689 | 2,229 |
| 2024 | 2 | 8,873 | 7,602 | 16,475 | -1,272 |
| 2024 | 3 | 9,322 | 7,975 | 17,297 | -1,346 |
| 2024 | 4 | 8,807 | 10,382 | 19,189 | 1,575 |
| 2024 | 5 | 9,594 | 9,122 | 18,716 | -472 |
| 2024 | 6 | 8,216 | 11,244 | 19,460 | 3,028 |
| 2024 | 7 | 8,967 | 10,589 | 19,556 | 1,623 |
| 2024 | 8 | 7,950 | 8,316 | 16,266 | 366 |
| 2024 | 9 | 9,007 | 9,445 | 18,452 | 437 |
| 2024 | 10 | 10,836 | 11,426 | 22,263 | 590 |
| 2024 | 11 | 10,818 | 11,271 | 22,089 | 452 |
| 2024 | 12 | 8,177 | 11,769 | 19,946 | 3,592 |
| 2025 | 1 | 13,147 | 8,051 | 21,198 | -5,096 |
| 2025 | 2 | 8,777 | 10,343 | 19,120 | 1,566 |
| 2025 | 3 | 11,694 | 9,331 | 21,026 | -2,363 |
| 2025 | 4 | 9,899 | 10,293 | 20,192 | 393 |
| 2025 | 5 | 8,114 | 8,253 | 16,368 | 139 |
| 2025 | 6 | 9,341 | 8,713 | 18,054 | -629 |
| 2025 | 7 | 34,189 | 15,591 | 49,781 | -18,598 |
| 2025 | 8 | 9,140 | 10,200 | 19,340 | 1,059 |
| 2025 | 9 | 11,327 | 11,701 | 23,028 | 374 |
| 2025 | 10 | 13,042 | 11,404 | 24,446 | -1,638 |
| 2025 | 11 | 18,762 | 10,403 | 29,165 | -8,359 |
| 2025 | 12 | 18,017 | 12,101 | 30,118 | -5,916 |
| 2026 | 1 | 10,503 | 8,910 | 19,413 | -1,593 |
| 2026 | 2 | 10,561 | 8,100 | 18,660 | -2,461 |
| 2026 | 3 | 11,986 | 10,140 | 22,126 | -1,846 |
| 2026 | 4 | 12,920 | 11,390 | 24,311 | -1,530 |
| 2026 | 5 | 12,572 | 7,744 | 20,315 | -4,828 |
| 2026 | 6 | 12,886 | 12,400 | 25,285 | -486 |
| 2026 | 7 | 14,124 | 11,977 | 26,101 | -2,147 |
| 2026 | 8 | 13,181 | 8,802 | 21,983 | -4,380 |

| 2026/4 | 2026/5 | 2026/6 | 2026/7 | 2026/8 | ||||||
|---|---|---|---|---|---|---|---|---|---|---|
| 1000 € | % | 1000 € | % | 1000 € | % | 1000 € | % | 1000 € | % | |
| 0. Food and live animals | 385 | 3.4 | 274 | 3.5 | 165 | 1.3 | 404 | 3.4 | 346 | 3.9 |
| 1. Beverages and tobacco | 411 | 3.6 | 309 | 4.0 | 537 | 4.3 | 513 | 4.3 | 366 | 4.2 |
| 2. Crude materials,inedible,except fuels | 945 | 8.3 | 889 | 11.5 | 1,068 | 8.6 | 775 | 6.5 | 1,093 | 12.4 |
| 3. Mineral fuels etc | 12 | 0.1 | 1 | 0.0 | ||||||
| 5. Chemicals and related products,n.e.s. | 1,104 | 9.7 | 79 | 1.0 | 2,199 | 17.7 | 537 | 4.5 | 221 | 2.5 |
| 6. Basic manufactures | 2,277 | 20.0 | 1,889 | 24.4 | 2,647 | 21.3 | 3,214 | 26.8 | 2,006 | 22.8 |
| 7. Machinery,transport equipment | 5,760 | 50.6 | 3,671 | 47.4 | 4,875 | 39.3 | 5,618 | 46.9 | 4,072 | 46.3 |
| 8. Miscellaneous manufactured articles | 469 | 4.1 | 594 | 7.7 | 859 | 6.9 | 876 | 7.3 | 658 | 7.5 |
| 9. Goods not classified elsewhere | 39 | 0.3 | 39 | 0.5 | 39 | 0.3 | 39 | 0.3 | 39 | 0.4 |
| All groups combined | 11,390 | 100.0 | 7,744 | 100.0 | 12,400 | 100.0 | 11,977 | 100.0 | 8,802 | 100.0 |
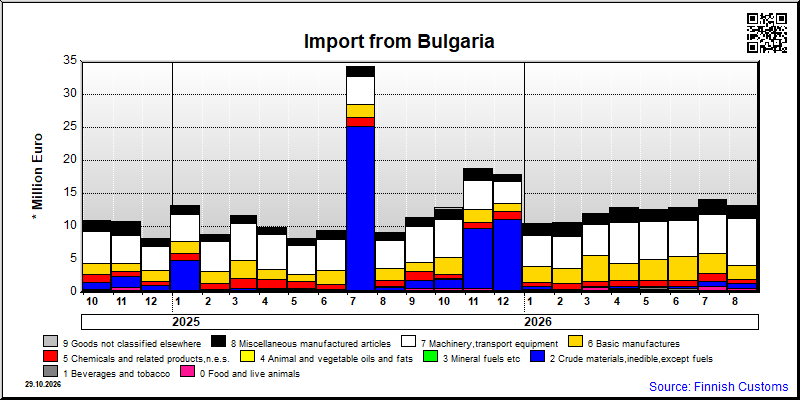
| 2026/4 | 2026/5 | 2026/6 | 2026/7 | 2026/8 | ||||||
|---|---|---|---|---|---|---|---|---|---|---|
| 1000 € | % | 1000 € | % | 1000 € | % | 1000 € | % | 1000 € | % | |
| 0. Food and live animals | 476 | 3.7 | 390 | 3.1 | 312 | 2.4 | 888 | 6.3 | 616 | 4.7 |
| 1. Beverages and tobacco | 123 | 0.9 | 335 | 2.7 | 234 | 1.8 | ||||
| 2. Crude materials,inedible,except fuels | 274 | 2.1 | 117 | 0.9 | 292 | 2.3 | 741 | 5.2 | 769 | 5.8 |
| 3. Mineral fuels etc | 1 | 0.0 | 19 | 0.1 | 36 | 0.3 | ||||
| 4. Animal and vegetable oils and fats | 1 | 0.0 | ||||||||
| 5. Chemicals and related products,n.e.s. | 931 | 7.2 | 1,031 | 8.2 | 958 | 7.4 | 1,221 | 8.6 | 570 | 4.3 |
| 6. Basic manufactures | 2,594 | 20.1 | 3,077 | 24.5 | 3,601 | 27.9 | 3,013 | 21.3 | 2,116 | 16.0 |
| 7. Machinery,transport equipment | 6,285 | 48.6 | 5,756 | 45.8 | 5,503 | 42.7 | 5,924 | 41.9 | 7,041 | 53.4 |
| 8. Miscellaneous manufactured articles | 2,239 | 17.3 | 1,865 | 14.8 | 1,982 | 15.4 | 2,320 | 16.4 | 2,033 | 15.4 |
| 9. Goods not classified elsewhere | 1 | 0.0 | 1 | 0.0 | ||||||
| All groups combined | 12,920 | 100.0 | 12,572 | 100.0 | 12,886 | 100.0 | 14,124 | 100.0 | 13,181 | 100.0 |
| Classification | Description | Year level | Quarter level | Month level | Year 2026 sofar |
|---|---|---|---|---|---|
| SITC | Standard International Trade Classification (classification system is maintained by the United Nations) | ███ | ███ | ███ | ███ |
| BEC | The standard of statistical classification of BEC (Broad Economic Categories) is upheld by the UN and it is based on SITC-nomenclature. | ███ | ███ | ███ | ███ |
| NACE | National industrial classification based on Statistical Classification of Economic Activities in the European Community Nomenclature générale des Activités économiques dans les Communautés européennes | ███ | ███ | ███ | ███ |
| CPA | CPA = Classification of Products by Activities | ███ | ███ | ███ | ███ |
| CN | The Combined Nomenclature is the common nomenclature of the European Community. | ███ | ███ | ███ | ███ |