
| Export of goods from Finland and import to Finland | Trade Balance |
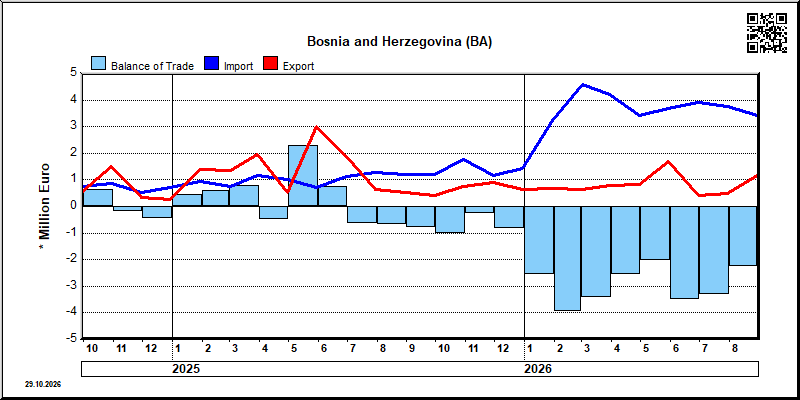
| Year | Month | Import 1,000 € | Export 1,000 € | Trade 1,000 € | Trade Balance 1,000 € |
|---|---|---|---|---|---|
| 2023 | 1 | 1,495 | 574 | 2,069 | -921 |
| 2023 | 2 | 867 | 1,728 | 2,595 | 861 |
| 2023 | 3 | 1,553 | 1,182 | 2,734 | -371 |
| 2023 | 4 | 1,423 | 1,463 | 2,886 | 40 |
| 2023 | 5 | 1,270 | 808 | 2,078 | -463 |
| 2023 | 6 | 1,085 | 1,699 | 2,784 | 613 |
| 2023 | 7 | 1,344 | 702 | 2,046 | -643 |
| 2023 | 8 | 1,381 | 390 | 1,772 | -991 |
| 2023 | 9 | 1,968 | 1,848 | 3,816 | -119 |
| 2023 | 10 | 1,204 | 819 | 2,023 | -384 |
| 2023 | 11 | 1,166 | 1,834 | 3,001 | 668 |
| 2023 | 12 | 1,234 | 846 | 2,080 | -389 |
| 2024 | 1 | 1,496 | 593 | 2,089 | -903 |
| 2024 | 2 | 1,014 | 665 | 1,678 | -349 |
| 2024 | 3 | 1,106 | 658 | 1,764 | -447 |
| 2024 | 4 | 1,097 | 605 | 1,703 | -492 |
| 2024 | 5 | 843 | 1,526 | 2,369 | 683 |
| 2024 | 6 | 1,006 | 697 | 1,703 | -309 |
| 2024 | 7 | 1,171 | 1,421 | 2,592 | 251 |
| 2024 | 8 | 1,521 | 381 | 1,903 | -1,140 |
| 2024 | 9 | 764 | 577 | 1,341 | -187 |
| 2024 | 10 | 848 | 1,500 | 2,349 | 652 |
| 2024 | 11 | 519 | 340 | 860 | -179 |
| 2024 | 12 | 732 | 268 | 1,000 | -464 |
| 2025 | 1 | 951 | 1,397 | 2,348 | 446 |
| 2025 | 2 | 740 | 1,335 | 2,075 | 595 |
| 2025 | 3 | 1,154 | 1,959 | 3,113 | 805 |
| 2025 | 4 | 1,018 | 537 | 1,555 | -481 |
| 2025 | 5 | 707 | 2,994 | 3,701 | 2,287 |
| 2025 | 6 | 1,139 | 1,877 | 3,016 | 738 |
| 2025 | 7 | 1,293 | 645 | 1,938 | -648 |
| 2025 | 8 | 1,202 | 526 | 1,729 | -676 |
| 2025 | 9 | 1,208 | 427 | 1,635 | -782 |
| 2025 | 10 | 1,754 | 738 | 2,492 | -1,017 |
| 2025 | 11 | 1,162 | 890 | 2,051 | -272 |
| 2025 | 12 | 1,446 | 635 | 2,081 | -811 |
| 2026 | 1 | 3,231 | 673 | 3,904 | -2,558 |
| 2026 | 2 | 4,598 | 633 | 5,230 | -3,965 |
| 2026 | 3 | 4,226 | 799 | 5,025 | -3,427 |
| 2026 | 4 | 3,408 | 844 | 4,252 | -2,565 |
| 2026 | 5 | 3,702 | 1,675 | 5,378 | -2,027 |
| 2026 | 6 | 3,897 | 412 | 4,309 | -3,485 |
| 2026 | 7 | 3,776 | 474 | 4,250 | -3,302 |
| 2026 | 8 | 3,413 | 1,172 | 4,585 | -2,241 |
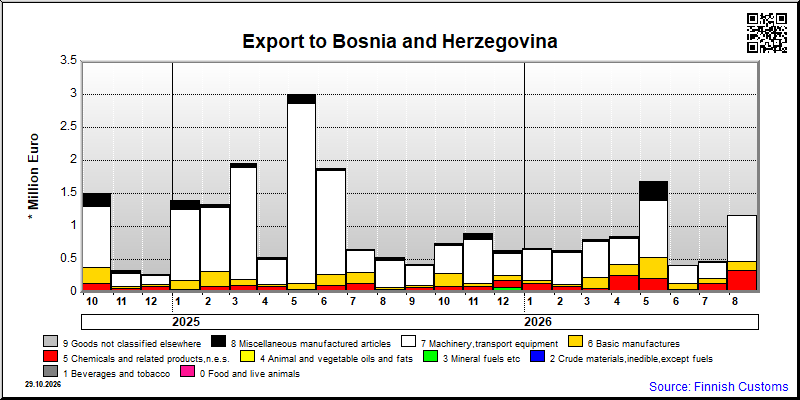
| 2026/4 | 2026/5 | 2026/6 | 2026/7 | 2026/8 | ||||||
|---|---|---|---|---|---|---|---|---|---|---|
| 1000 € | % | 1000 € | % | 1000 € | % | 1000 € | % | 1000 € | % | |
| 2. Crude materials,inedible,except fuels | 21 | 1.3 | ||||||||
| 5. Chemicals and related products,n.e.s. | 263 | 31.1 | 198 | 11.8 | 45 | 11.0 | 142 | 30.0 | 340 | 29.1 |
| 6. Basic manufactures | 156 | 18.5 | 307 | 18.3 | 95 | 22.9 | 72 | 15.1 | 135 | 11.5 |
| 7. Machinery,transport equipment | 396 | 46.9 | 874 | 52.2 | 263 | 63.9 | 241 | 50.7 | 686 | 58.5 |
| 8. Miscellaneous manufactured articles | 29 | 3.5 | 275 | 16.4 | 9 | 2.1 | 20 | 4.2 | 11 | 0.9 |
| All groups combined | 844 | 100.0 | 1,675 | 100.0 | 412 | 100.0 | 474 | 100.0 | 1,172 | 100.0 |
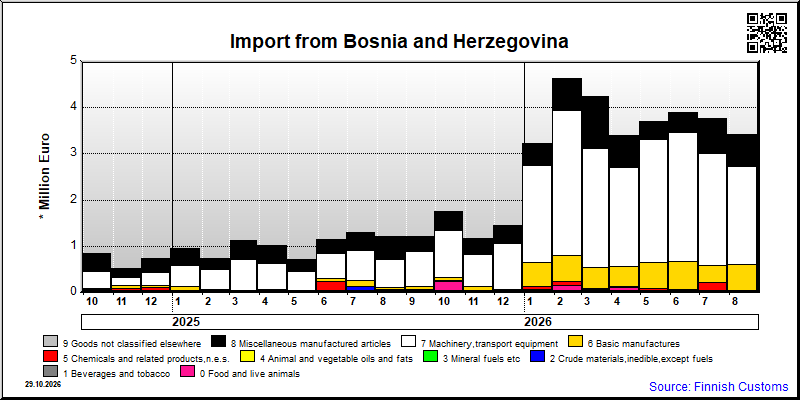
| 2026/4 | 2026/5 | 2026/6 | 2026/7 | 2026/8 | ||||||
|---|---|---|---|---|---|---|---|---|---|---|
| 1000 € | % | 1000 € | % | 1000 € | % | 1000 € | % | 1000 € | % | |
| 0. Food and live animals | 113 | 3.3 | 47 | 1.3 | 45 | 1.2 | 24 | 0.6 | 38 | 1.1 |
| 1. Beverages and tobacco | ||||||||||
| 5. Chemicals and related products,n.e.s. | 11 | 0.3 | 34 | 0.9 | 29 | 0.7 | 199 | 5.3 | 3 | 0.1 |
| 6. Basic manufactures | 445 | 13.1 | 569 | 15.4 | 600 | 15.4 | 352 | 9.3 | 571 | 16.7 |
| 7. Machinery,transport equipment | 2,140 | 62.8 | 2,668 | 72.1 | 2,795 | 71.7 | 2,432 | 64.4 | 2,122 | 62.2 |
| 8. Miscellaneous manufactured articles | 699 | 20.5 | 384 | 10.4 | 428 | 11.0 | 769 | 20.4 | 680 | 19.9 |
| 9. Goods not classified elsewhere | ||||||||||
| All groups combined | 3,408 | 100.0 | 3,702 | 100.0 | 3,897 | 100.0 | 3,776 | 100.0 | 3,413 | 100.0 |
| Classification | Description | Year level | Quarter level | Month level | Year 2026 sofar |
|---|---|---|---|---|---|
| SITC | Standard International Trade Classification (classification system is maintained by the United Nations) | ███ | ███ | ███ | ███ |
| BEC | The standard of statistical classification of BEC (Broad Economic Categories) is upheld by the UN and it is based on SITC-nomenclature. | ███ | ███ | ███ | ███ |
| NACE | National industrial classification based on Statistical Classification of Economic Activities in the European Community Nomenclature générale des Activités économiques dans les Communautés européennes | ███ | ███ | ███ | ███ |
| CPA | CPA = Classification of Products by Activities | ███ | ███ | ███ | ███ |
| CN | The Combined Nomenclature is the common nomenclature of the European Community. | ███ | ███ | ███ | ███ |