
| Export of goods from Finland and import to Finland | Trade Balance |
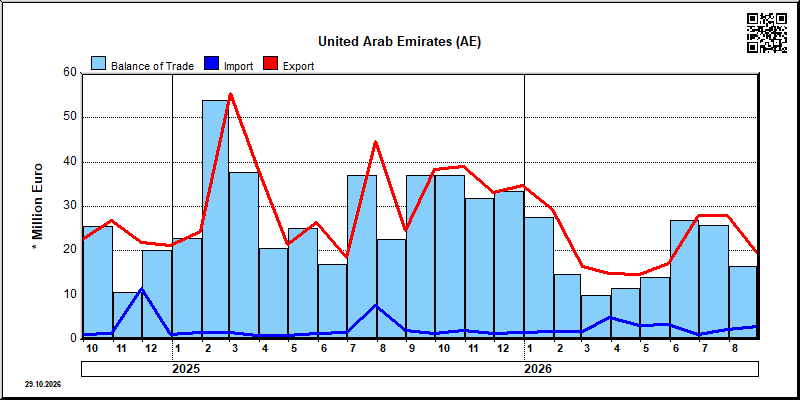
| Year | Month | Import 1,000 € | Export 1,000 € | Trade 1,000 € | Trade Balance 1,000 € |
|---|---|---|---|---|---|
| 2023 | 1 | 1,530 | 122,368 | 123,897 | 120,838 |
| 2023 | 2 | 1,272 | 11,187 | 12,459 | 9,915 |
| 2023 | 3 | 1,434 | 17,199 | 18,633 | 15,765 |
| 2023 | 4 | 903 | 18,232 | 19,135 | 17,329 |
| 2023 | 5 | 969 | 14,862 | 15,831 | 13,892 |
| 2023 | 6 | 2,160 | 38,730 | 40,890 | 36,570 |
| 2023 | 7 | 3,496 | 16,183 | 19,679 | 12,687 |
| 2023 | 8 | 1,497 | 20,168 | 21,665 | 18,670 |
| 2023 | 9 | 1,578 | 19,829 | 21,407 | 18,251 |
| 2023 | 10 | 1,889 | 21,181 | 23,071 | 19,292 |
| 2023 | 11 | 1,233 | 21,242 | 22,475 | 20,009 |
| 2023 | 12 | 939 | 17,593 | 18,532 | 16,655 |
| 2024 | 1 | 1,230 | 23,724 | 24,954 | 22,494 |
| 2024 | 2 | 908 | 15,525 | 16,433 | 14,617 |
| 2024 | 3 | 886 | 9,603 | 10,489 | 8,716 |
| 2024 | 4 | 1,140 | 15,225 | 16,365 | 14,085 |
| 2024 | 5 | 968 | 22,844 | 23,812 | 21,876 |
| 2024 | 6 | 5,136 | 20,201 | 25,337 | 15,065 |
| 2024 | 7 | 992 | 23,865 | 24,857 | 22,872 |
| 2024 | 8 | 898 | 18,795 | 19,693 | 17,897 |
| 2024 | 9 | 1,102 | 22,663 | 23,766 | 21,561 |
| 2024 | 10 | 1,354 | 26,938 | 28,292 | 25,584 |
| 2024 | 11 | 11,458 | 21,966 | 33,423 | 10,508 |
| 2024 | 12 | 1,226 | 21,306 | 22,533 | 20,080 |
| 2025 | 1 | 1,562 | 24,437 | 25,999 | 22,875 |
| 2025 | 2 | 1,663 | 55,473 | 57,136 | 53,810 |
| 2025 | 3 | 1,014 | 38,729 | 39,742 | 37,715 |
| 2025 | 4 | 962 | 21,459 | 22,421 | 20,497 |
| 2025 | 5 | 1,340 | 26,352 | 27,692 | 25,013 |
| 2025 | 6 | 1,494 | 18,502 | 19,996 | 17,009 |
| 2025 | 7 | 7,653 | 44,663 | 52,316 | 37,010 |
| 2025 | 8 | 2,001 | 24,607 | 26,609 | 22,606 |
| 2025 | 9 | 1,396 | 38,419 | 39,815 | 37,023 |
| 2025 | 10 | 2,132 | 39,067 | 41,199 | 36,935 |
| 2025 | 11 | 1,416 | 33,247 | 34,663 | 31,830 |
| 2025 | 12 | 1,497 | 34,810 | 36,307 | 33,312 |
| 2026 | 1 | 1,731 | 29,344 | 31,075 | 27,613 |
| 2026 | 2 | 1,792 | 16,482 | 18,274 | 14,691 |
| 2026 | 3 | 4,888 | 14,873 | 19,761 | 9,985 |
| 2026 | 4 | 3,047 | 14,629 | 17,676 | 11,581 |
| 2026 | 5 | 3,341 | 17,223 | 20,565 | 13,882 |
| 2026 | 6 | 1,210 | 28,066 | 29,276 | 26,856 |
| 2026 | 7 | 2,218 | 27,883 | 30,101 | 25,665 |
| 2026 | 8 | 2,852 | 19,355 | 22,207 | 16,504 |

| 2026/4 | 2026/5 | 2026/6 | 2026/7 | 2026/8 | ||||||
|---|---|---|---|---|---|---|---|---|---|---|
| 1000 € | % | 1000 € | % | 1000 € | % | 1000 € | % | 1000 € | % | |
| 0. Food and live animals | 35 | 0.2 | 500 | 2.9 | 968 | 3.4 | 173 | 0.6 | 435 | 2.2 |
| 1. Beverages and tobacco | 2 | 0.0 | 33 | 0.1 | 49 | 0.2 | 9 | 0.0 | ||
| 2. Crude materials,inedible,except fuels | 817 | 4.7 | 566 | 2.0 | 1,045 | 3.7 | 1,121 | 5.8 | ||
| 3. Mineral fuels etc | 1 | 0.0 | 1 | 0.0 | ||||||
| 5. Chemicals and related products,n.e.s. | 330 | 2.3 | 864 | 5.0 | 1,290 | 4.6 | 156 | 0.6 | 484 | 2.5 |
| 6. Basic manufactures | 1,697 | 11.6 | 2,201 | 12.8 | 2,711 | 9.7 | 4,158 | 14.9 | 1,550 | 8.0 |
| 7. Machinery,transport equipment | 10,230 | 69.9 | 11,966 | 69.5 | 18,756 | 66.8 | 19,852 | 71.2 | 13,159 | 68.0 |
| 8. Miscellaneous manufactured articles | 2,335 | 16.0 | 873 | 5.1 | 3,729 | 13.3 | 2,452 | 8.8 | 2,596 | 13.4 |
| 9. Goods not classified elsewhere | 13 | 0.0 | ||||||||
| All groups combined | 14,629 | 100.0 | 17,223 | 100.0 | 28,066 | 100.0 | 27,883 | 100.0 | 19,355 | 100.0 |

| 2026/4 | 2026/5 | 2026/6 | 2026/7 | 2026/8 | ||||||
|---|---|---|---|---|---|---|---|---|---|---|
| 1000 € | % | 1000 € | % | 1000 € | % | 1000 € | % | 1000 € | % | |
| 0. Food and live animals | 1 | 0.0 | 30 | 0.9 | 10 | 0.8 | 3 | 0.1 | 3 | 0.1 |
| 1. Beverages and tobacco | 3 | 0.1 | ||||||||
| 2. Crude materials,inedible,except fuels | 929 | 30.5 | 57 | 1.7 | ||||||
| 5. Chemicals and related products,n.e.s. | 119 | 3.9 | 1,358 | 40.7 | 505 | 41.7 | 944 | 42.5 | 1,227 | 43.0 |
| 6. Basic manufactures | 413 | 13.5 | 1,261 | 37.7 | 210 | 17.3 | 576 | 26.0 | 193 | 6.8 |
| 7. Machinery,transport equipment | 1,408 | 46.2 | 464 | 13.9 | 336 | 27.8 | 547 | 24.6 | 1,063 | 37.3 |
| 8. Miscellaneous manufactured articles | 157 | 5.2 | 149 | 4.5 | 132 | 10.9 | 136 | 6.1 | 350 | 12.3 |
| 9. Goods not classified elsewhere | 19 | 0.6 | 22 | 0.7 | 18 | 1.4 | 13 | 0.6 | 12 | 0.4 |
| All groups combined | 3,047 | 100.0 | 3,341 | 100.0 | 1,210 | 100.0 | 2,218 | 100.0 | 2,852 | 100.0 |
| Classification | Description | Year level | Quarter level | Month level | Year 2026 sofar |
|---|---|---|---|---|---|
| SITC | Standard International Trade Classification (classification system is maintained by the United Nations) | ███ | ███ | ███ | ███ |
| BEC | The standard of statistical classification of BEC (Broad Economic Categories) is upheld by the UN and it is based on SITC-nomenclature. | ███ | ███ | ███ | ███ |
| NACE | National industrial classification based on Statistical Classification of Economic Activities in the European Community Nomenclature générale des Activités économiques dans les Communautés européennes | ███ | ███ | ███ | ███ |
| CPA | CPA = Classification of Products by Activities | ███ | ███ | ███ | ███ |
| CN | The Combined Nomenclature is the common nomenclature of the European Community. | ███ | ███ | ███ | ███ |