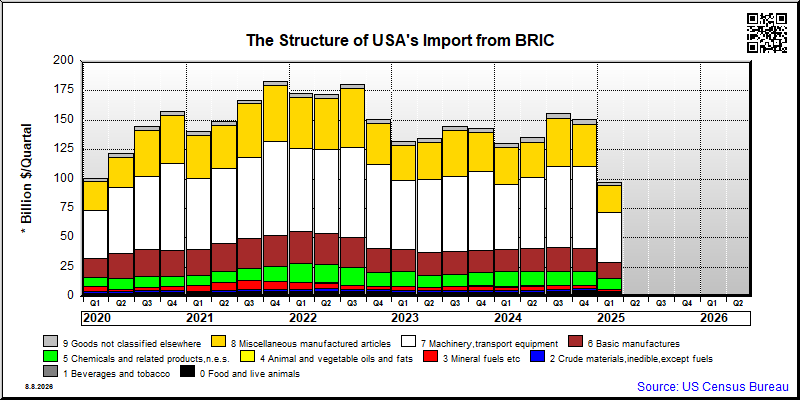
| 0. Food and live animals | 4,774 | 3.2 | 3,624 | 31.7 |
| 00. Live animals | 6 | 0.0 | 6 | -5.4 |
| 01. Meat and meat preparations | 513 | 0.3 | 204 | 151.7 |
| 02. Dairy products and birds' eggs | 28 | 0.0 | 17 | 68.3 |
| 03. Fish and fish preparations | 1,224 | 0.8 | 1,083 | 13.0 |
| 04. Cereals and cereal preparations | 301 | 0.2 | 264 | 13.7 |
| 05. Vegetables and fruit | 992 | 0.7 | 761 | 30.3 |
| 06. Sugars,sugar preparations and honey | 335 | 0.2 | 405 | -17.3 |
| 07. Coffee,tea,cocoa,spices | 970 | 0.6 | 568 | 70.8 |
| 08. Feeding stuff for animals | 93 | 0.1 | 81 | 14.7 |
| 09. Miscellaneous edible products and preparations | 312 | 0.2 | 235 | 32.8 |
| 1. Beverages and tobacco | 119 | 0.1 | 96 | 23.7 |
| 11. Beverages | 36 | 0.0 | 49 | -26.9 |
| 12. Tobacco and tobacco manufactures | 83 | 0.1 | 47 | 75.9 |
| 2. Crude materials,inedible,except fuels | 1,579 | 1.0 | 1,247 | 26.7 |
| 21. Hides,skins,furskins,raw | 0 | 0.0 | 1 | -74.7 |
| 22. Oil seeds,oleaginous fruits | 26 | 0.0 | 31 | -18.2 |
| 23. Crude rubber (incl.synthetic) | 21 | 0.0 | 15 | 41.3 |
| 24. Cork and wood | 182 | 0.1 | 168 | 8.4 |
| 25. Pulp and waste paper | 460 | 0.3 | 282 | 62.9 |
| 26. Textile fibres and their wastes | 62 | 0.0 | 46 | 33.2 |
| 27. Crude fertilizers and crude minerals | 108 | 0.1 | 111 | -3.1 |
| 28. Metalliferous ores and metal scrap | 287 | 0.2 | 225 | 27.5 |
| 29. Crude animal,vegetable materials n.e.s. | 433 | 0.3 | 366 | 18.2 |
| 3. Mineral fuels etc | 2,605 | 1.7 | 3,718 | -29.9 |
| 32. Coal,coke and briquettes | 2 | 0.0 | 5 | -61.0 |
| 33. Petroleum and products | 2,601 | 1.7 | 3,713 | -29.9 |
| 34. Gas,natural and manufactured | 1 | 0.0 | 0 | 387.9 |
| 4. Animal and vegetable oils and fats | 441 | 0.3 | 490 | -9.9 |
| 41. Animal oils and fats | 86 | 0.1 | 118 | -27.3 |
| 42. Fixed vegetable fats and oils | 56 | 0.0 | 53 | 5.3 |
| 43. Processed animal or vegetable oils,etc. | 300 | 0.2 | 319 | -6.0 |
| 5. Chemicals and related products,n.e.s. | 11,733 | 7.8 | 11,213 | 4.6 |
| 51. Organic chemicals | 2,633 | 1.7 | 2,365 | 11.3 |
| 52. Inorganic chemicals | 577 | 0.4 | 1,186 | -51.4 |
| 53. Dyeing,tanning and colouring material | 197 | 0.1 | 143 | 37.1 |
| 54. Medicinal and pharmaceutical products | 5,546 | 3.7 | 5,009 | 10.7 |
| 55. Perfume,cleaning etc.preparations | 682 | 0.5 | 586 | 16.4 |
| 56. Fertilizers,manufactured | 212 | 0.1 | 256 | -17.4 |
| 57. Plastics in primary forms | 350 | 0.2 | 277 | 26.4 |
| 58. Plastics in non-primary forms | 535 | 0.4 | 479 | 11.7 |
| 59. Chemical materials and products,n.e.s. | 1,002 | 0.7 | 911 | 10.0 |
| 6. Basic manufactures | 19,919 | 13.2 | 18,601 | 7.1 |
| 61. Leather,dressed fur,etc. | 103 | 0.1 | 98 | 5.9 |
| 62. Rubber manufactures,n.e.s. | 811 | 0.5 | 828 | -2.1 |
| 63. Wood and cork manufactures | 798 | 0.5 | 727 | 9.8 |
| 64. Paper,paperboard and articles thereof | 930 | 0.6 | 860 | 8.1 |
| 65. Textile yarn,fabrics,made up articles,etc. | 4,383 | 2.9 | 3,880 | 12.9 |
| 66. Non-metallic mineral manufactures,n.e.s. | 3,699 | 2.5 | 3,896 | -5.1 |
| 67. Iron and steel | 1,750 | 1.2 | 1,634 | 7.1 |
| 68. Non-ferrous metals | 986 | 0.7 | 819 | 20.4 |
| 69. Manufactures of metals,n.e.s. | 6,459 | 4.3 | 5,859 | 10.2 |
| 7. Machinery,transport equipment | 69,656 | 46.2 | 67,666 | 2.9 |
| 71. Power generating machinery and equipment | 2,032 | 1.3 | 2,004 | 1.4 |
| 72. Machinery for specialized industries | 2,355 | 1.6 | 2,527 | -6.8 |
| 73. Metal working machinery | 319 | 0.2 | 258 | 24.0 |
| 74. General industrial machinery n.e.s. | 6,835 | 4.5 | 5,999 | 13.9 |
| 75. Office machines and adp machines | 11,484 | 7.6 | 11,419 | 0.6 |
| 76. Telecommunications and sound recording equipment | 23,838 | 15.8 | 24,754 | -3.7 |
| 77. Electric machinery,n.e.s.and parts | 16,886 | 11.2 | 15,290 | 10.4 |
| 78. Road vehicles | 4,953 | 3.3 | 4,492 | 10.2 |
| 79. Other transport equipment | 953 | 0.6 | 922 | 3.3 |
| 8. Miscellaneous manufactured articles | 35,691 | 23.7 | 32,959 | 8.3 |
| 81. Prefabr.buildings;sanitary,lighting etc.fixtrs | 1,274 | 0.8 | 1,274 | 0.0 |
| 82. Furniture and parts thereof | 3,712 | 2.5 | 3,954 | -6.1 |
| 83. Travel goods,handbags and sim.containers | 741 | 0.5 | 720 | 3.0 |
| 84. Articles of apparel and clothing accessories | 6,063 | 4.0 | 5,246 | 15.6 |
| 85. Footwear | 2,371 | 1.6 | 2,155 | 10.0 |
| 87. Instruments and apparates n.e.s. | 2,464 | 1.6 | 2,208 | 11.6 |
| 88. Photographic equipment,optical goods etc. | 781 | 0.5 | 708 | 10.3 |
| 89. Miscellaneous manufactured articles,n.e.s. | 18,285 | 12.1 | 16,694 | 9.5 |
| 9. Goods not classified elsewhere | 4,188 | 2.8 | 3,781 | 10.8 |
| 93. Special transactions and commodities not classified | 2,516 | 1.7 | 2,327 | 8.1 |
| 96. Coin (not gold coin or legal) | 2 | 0.0 | 2 | -5.4 |
| 97. Gold,non-monetary | 122 | 0.1 | 42 | 190.5 |
| 98. (USA Sitc) Estimate of import items valued under $251 and of other low valued items nonexempt from formal entry | 1,536 | 1.0 | 1,403 | 9.5 |
| All groups combined | 150,705 | 100.0 | 143,396 | 5.1 |