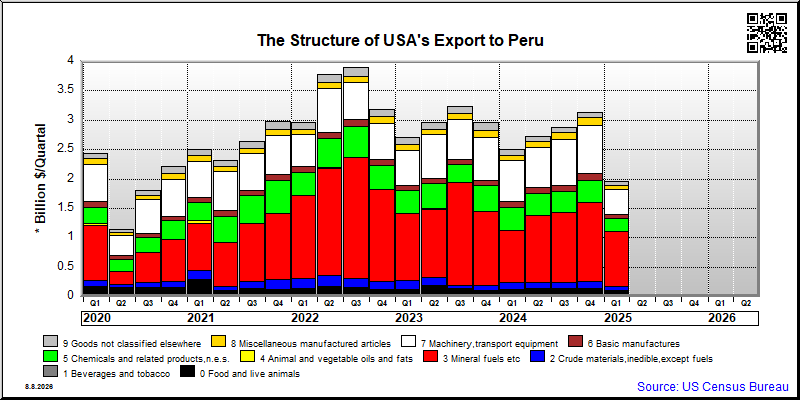
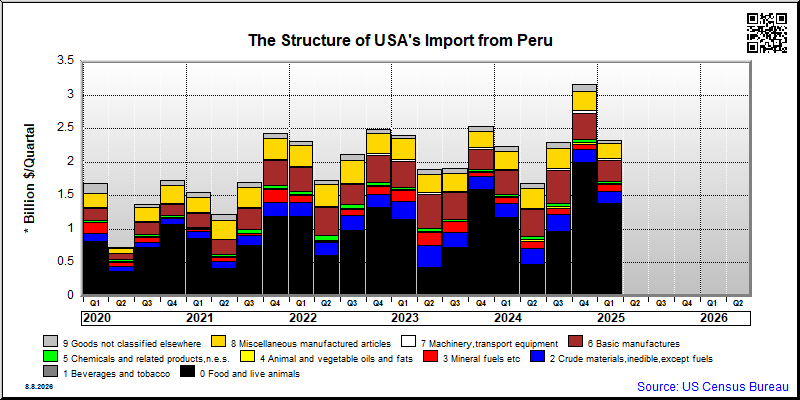
| 0. Food and live animals | 139 | 4.4 | 103 | 35.0 |
| 00. Live animals | 1 | 0.0 | 0 | 235.8 |
| 01. Meat and meat preparations | 23 | 0.7 | 18 | 25.7 |
| 02. Dairy products and birds' eggs | 35 | 1.1 | 25 | 38.6 |
| 03. Fish and fish preparations | 1 | 0.0 | 0 | .. |
| 04. Cereals and cereal preparations | 6 | 0.2 | 10 | -39.5 |
| 05. Vegetables and fruit | 26 | 0.8 | 19 | 39.0 |
| 06. Sugars,sugar preparations and honey | 1 | 0.0 | 1 | -2.8 |
| 07. Coffee,tea,cocoa,spices | 6 | 0.2 | 4 | 41.7 |
| 08. Feeding stuff for animals | 27 | 0.8 | 11 | 132.4 |
| 09. Miscellaneous edible products and preparations | 14 | 0.4 | 14 | -3.2 |
| 1. Beverages and tobacco | 2 | 0.1 | 3 | -13.2 |
| 11. Beverages | 2 | 0.1 | 2 | -24.1 |
| 12. Tobacco and tobacco manufactures | 1 | 0.0 | 0 | 59.1 |
| 2. Crude materials,inedible,except fuels | 116 | 3.7 | 82 | 41.3 |
| 21. Hides,skins,furskins,raw | 0 | 0 | 0 | .. |
| 22. Oil seeds,oleaginous fruits | 21 | 0.7 | 0 | .. |
| 23. Crude rubber (incl.synthetic) | 4 | 0.1 | 3 | 24.5 |
| 24. Cork and wood | 2 | 0.1 | 2 | 36.0 |
| 25. Pulp and waste paper | 8 | 0.2 | 5 | 39.7 |
| 26. Textile fibres and their wastes | 24 | 0.8 | 11 | 130.8 |
| 27. Crude fertilizers and crude minerals | 4 | 0.1 | 2 | 131.7 |
| 28. Metalliferous ores and metal scrap | 47 | 1.5 | 54 | -13.6 |
| 29. Crude animal,vegetable materials n.e.s. | 6 | 0.2 | 6 | 5.7 |
| 3. Mineral fuels etc | 1,348 | 43.0 | 1,262 | 6.8 |
| 32. Coal,coke and briquettes | 0 | 0 | 0 | .. |
| 33. Petroleum and products | 1,286 | 41.0 | 1,192 | 7.9 |
| 34. Gas,natural and manufactured | 62 | 2.0 | 70 | -11.6 |
| 4. Animal and vegetable oils and fats | 1 | 0.0 | 1 | 104.0 |
| 41. Animal oils and fats | 1 | 0.0 | 0 | 169.5 |
| 42. Fixed vegetable fats and oils | 0 | 0.0 | 0 | -7.7 |
| 43. Processed animal or vegetable oils,etc. | 0 | 0.0 | 0 | 61.0 |
| 5. Chemicals and related products,n.e.s. | 367 | 11.7 | 439 | -16.3 |
| 51. Organic chemicals | 69 | 2.2 | 63 | 10.3 |
| 52. Inorganic chemicals | 18 | 0.6 | 26 | -29.5 |
| 53. Dyeing,tanning and colouring material | 10 | 0.3 | 13 | -19.9 |
| 54. Medicinal and pharmaceutical products | 33 | 1.1 | 103 | -67.4 |
| 55. Perfume,cleaning etc.preparations | 12 | 0.4 | 11 | 12.5 |
| 56. Fertilizers,manufactured | 19 | 0.6 | 34 | -43.3 |
| 57. Plastics in primary forms | 133 | 4.2 | 111 | 19.8 |
| 58. Plastics in non-primary forms | 7 | 0.2 | 11 | -39.8 |
| 59. Chemical materials and products,n.e.s. | 65 | 2.1 | 68 | -4.5 |
| 6. Basic manufactures | 113 | 3.6 | 88 | 28.1 |
| 61. Leather,dressed fur,etc. | 0 | 0.0 | 0 | -50.5 |
| 62. Rubber manufactures,n.e.s. | 47 | 1.5 | 32 | 47.7 |
| 63. Wood and cork manufactures | 0 | 0.0 | 0 | -1.1 |
| 64. Paper,paperboard and articles thereof | 12 | 0.4 | 10 | 20.2 |
| 65. Textile yarn,fabrics,made up articles,etc. | 8 | 0.3 | 7 | 22.7 |
| 66. Non-metallic mineral manufactures,n.e.s. | 6 | 0.2 | 6 | -3.4 |
| 67. Iron and steel | 8 | 0.2 | 7 | 16.8 |
| 68. Non-ferrous metals | 4 | 0.1 | 3 | 40.3 |
| 69. Manufactures of metals,n.e.s. | 28 | 0.9 | 24 | 16.8 |
| 7. Machinery,transport equipment | 832 | 26.5 | 723 | 15.0 |
| 71. Power generating machinery and equipment | 77 | 2.5 | 66 | 17.4 |
| 72. Machinery for specialized industries | 100 | 3.2 | 106 | -6.1 |
| 73. Metal working machinery | 5 | 0.2 | 4 | 23.9 |
| 74. General industrial machinery n.e.s. | 148 | 4.7 | 142 | 4.4 |
| 75. Office machines and adp machines | 87 | 2.8 | 85 | 2.2 |
| 76. Telecommunications and sound recording equipment | 68 | 2.2 | 60 | 12.3 |
| 77. Electric machinery,n.e.s.and parts | 76 | 2.4 | 65 | 17.9 |
| 78. Road vehicles | 116 | 3.7 | 111 | 4.8 |
| 79. Other transport equipment | 155 | 4.9 | 85 | 82.3 |
| 8. Miscellaneous manufactured articles | 128 | 4.1 | 125 | 2.0 |
| 81. Prefabr.buildings;sanitary,lighting etc.fixtrs | 3 | 0.1 | 3 | -10.1 |
| 82. Furniture and parts thereof | 3 | 0.1 | 2 | 31.7 |
| 83. Travel goods,handbags and sim.containers | 1 | 0.0 | 1 | 25.9 |
| 84. Articles of apparel and clothing accessories | 6 | 0.2 | 5 | 25.8 |
| 85. Footwear | 1 | 0.0 | 1 | -12.5 |
| 87. Instruments and apparates n.e.s. | 56 | 1.8 | 51 | 11.2 |
| 88. Photographic equipment,optical goods etc. | 10 | 0.3 | 11 | -7.5 |
| 89. Miscellaneous manufactured articles,n.e.s. | 48 | 1.5 | 52 | -7.9 |
| 9. Goods not classified elsewhere | 87 | 2.8 | 128 | -31.8 |
| 93. Special transactions and commodities not classified | 5 | 0.2 | 2 | 126.4 |
| 97. Gold,non-monetary | 3 | 0.1 | 48 | -93.6 |
| 99. (USA Sitc) Estimate of non-canadian low value shipments; compiled low value shipments to canada; and various export shipments not identified by kind | 80 | 2.5 | 78 | 1.7 |
| All groups combined | 3,134 | 100.0 | 2,954 | 6.1 |